Is School 2.0 the Wrong Conversation?

My only consolation, at this moment, is that it's one hour later where I live than it is right here and now. Since scaling back the number of days I'm on the road and, as a result, peeling away many layers of stress, I've learned to sleep eight hours a night, that is to say that I've learned to be woken by an alarm clock. But here, at ISTE, that's all out the window. I'm waking up at absurd hours … thinking!

I am also obliged to (blame this on) recognize that of all of the learning opportunities I've attended and attended-to at ISTE13, the ones that have truly pushed my thinking have all been facilitated by Steve Hargadon.

Steve is a forge!

The heat of the conversations he instigates and the amazing thinkers he interview for The Future of Education, soften the metal of some of my most valued visions and reshape them into ideas that are better … that excite me … that make it hard for me to sleep.

If we succeed in hacking education into something that is, once again, relevant, we will owe more to Steve Hargadon than we will ever know.

What's got me awake now and anxious to blog again? Well, it started with Hack Education on Saturday. The best conversations often cycle around to, “Now how do we sell this? How do we convince administrations, other teachers, our parents and communities to see and understand this new vision education – SCHOOL 2.0?”

During some of these conversations and the inner-conversations that happen in my own head, I was struck by the fact that our description of new schooling does not necessarily change the look of schools and classrooms in any way that inspires acceptance and commitment. It's all about the what and the how of our children's learning.

It is crucial that we understand this, because to convince others of our vision, we must have something to point to – something for others to look at.

So, what if we could point to Student 2.0? It's not a new phrase nor is it a new idea. Clay Burell (Beyond School) instigated or facilitated Student 2.0 years ago. It was evidently a blogging platform that several “students” used to voice their passions. I'll not share the URL here, because it has fallen into neglect and been grabbed by one of those domain hijackers.

Perhaps we should take this on. Perhaps, rather than trying to define the classroom and the school of the 21st century, we should be imagining and describing the student/learner of this post-industrial and change-fueled time.

  • What will they talk about after school?
  • How will they act after school?
  • What will homework become to them?
  • What products will they bring home or into their communities?
  • In what ways might their personal passions be manifestly tied to their school?
  • How might they excite their parents, neighbors and greater communities?

If we can answer these questions, recognizing that we don't all need to come to the same answers, then we can design the schools that inspire those students.

When communities can see these youngsters walk away of their schools without walking away from schooling, then we might be able to re-vision formal education for others.


Jane McGonigal’s Keynote — Reflections

I saw McGonigal's keynote last night, through the din of subdued Bogger Cafe murmurings. It was a fun presentation with lots of useful information, especially the statistics. But I was certain that the last time I saw her, McGonigal had a British accent. I'm old. Forgive me.

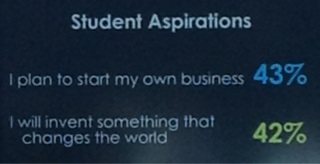
One set of numbers that I thought were especially telling described student aspirations — that 43% of students want to start their own business and 42% plan to invent something that changes the world. Is it the job of formal education to support our children in these aspirations, or indoctrinate them with the harsh reality that they will work for someone else, follow instructions and fit in. I suspect that a lot of the products in the exhibit are designed for the latter.

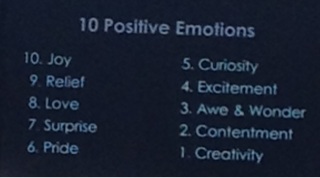
Another compelling part of the presentation was a listing of the 10 positive emotions that result from playing games. Although I am certain that there were many educators in the audience who needed to see that video games are not, necessarily, the root of all evi — I watched the keynote, wondering if Jane McGonigal was speaking to group of game designers, is this the presentation she would be giving? How playing games affects children is useful. But what would truly help me is understanding the mechanisms that evoke those emotions. How do games do it — and how might formal learning experiences pull those same triggers.

Of course, what was most fun was the MMTW, that is Massively Multiplayer Thumb Wrestling. I won't tell you how I did, but it might be my next book.

My ISTE Un-Presentation

UntitledAs my wife was driving me to the airport on Friday, I suddenly noticed how relaxed I was. It was a striking realization that, because I decided not to submit any proposals to the ISTE committee this year, I am approaching the conference with a new and unfamiliar perspective. I’m an attendee. My attendee badge is entirely unadorned with ribbons. It feel so good.

That said, a number of weeks ago someone with the K-12 Online Conference re-posted a presentation that I did for them back in 2006.  I watched it, and with only a few exceptions, there is little that I could talk able today that isn’t part of that virtual address from seven years ago.  

So, I downloaded the video, deleted out some of the dated material (2006 was pre-Twitter and pre-Facebook) and reposted it to my own channel.  If you get a few minutes, give it a view.

Individualized Instruction Vs. Personalized Learning

This is one of those blog posts intended to help me shape my own thoughts – and asks you, “How close I am to the real world of teaching and learning?”

With nearly four decades of experience in education, I’ve seen initiatives and memes come and go, pumped up and deflated by the hot and cold air of the education conversation. None of it, quite frankly, has had much effect on my personal philosophies of education – and I suspect the same can be said for many of you. Hopefully, we’ve simply become better at voicing those philosophies.

So this morning, I’d like to explore what appears to me to be a passing of conversational energy (hot air) from the term, individualized instruction to personalized learning. This shift can be seen with a Google Trends analysis, comparing the number of searches of both phrases from 2005 to 2013 and projected beyond.

Graph of the shifting interest (Google Trends) between Individualized Instruction and Personalized Learning

The concepts, in my mind, are quite different. However, in practice, I fear that they could be implemented in the same way. Personalized learning, in essence, is a life-long practice, as it is for you and me, as we live and learn independent of teachers, textbooks, and learning standards.  Individualized instruction is more contained.

So here is a little more breakdown, as I see it, of the differences between personalized learning and individual instruction – acknowledging that this is not strictly an either/or proposition. Please comment your thoughts.

  Individualized Instruction Personalized Learning
Definition Planned & implemented instructional strategies based on knowledge of best practices and analysis of individual student readiness, learning styles and areas of interest. Learner devised learning activities based on reflection and conversations with teachers and other stakeholders, and a resourceful use of a growing knowledge of resources and personal learning strategies.
Literacy Becomes a.. ..mastery of a defined scope and sequence of institutionally established reading and writing skills — in addition to numeracy ..wide range of evolving information skills developed around the activities of learning – the ability to acquire knowledge and skills through the resourceful and responsible utilization of information.
Teacher’s Role Use data that provides a description of individual students’ proficiencies in order to select best practice strategies that help each student to master competencies defined by established standards.
  1. Create, craft and maintain a learning environment where learners are free to safely and effectively pursue personal interests.
  2. Guide learning experiences in order to maintain a healthy and comprehensive environmental and societal context that nurtures knowledgable, resourceful and caring citizens.
  3. Assist learners in developing and refining personal learning literacies and habits.
Student’s Role Pay attention to the teacher, follow instructions, remember and perform. Pay attention to the world, consult with the teacher (and others), identify and pursue emerging areas of interest, resourcefully learn and produce from that learning.
Standards A rich set of institutionally and politically established competencies that are founded on basic literacies and that can be tested, measured and converted into data that is optimally available to teachers for refining instruction. A much more shallow framework of competencies, founded on learning literacies, and demonstrated through original, compelling and valuable published or constructed works.
Outcomes Literate and knowledgeable performers. Skilled, knowledgeable, curious, compassionate, wise and engaged life-long learners.
It’s Essence Education is done to the student Education happens as a result of what the learner does.

What do you think?


ISTE Session Trends

In the past I have done word counts from ISTE’s conference programs to illustrate topic trends, especially during the early days of the social web.  Its fairly unscientific, because there are lots of factors that determine the verbiage of session descriptions, especially for a conference as discerning as ISTE.

This year, I decided to do the same, but also use the activity as an opportunity for playing around with Tumult HYPE 1.6, a Macintosh app for creating HTML5 animations.  From their web site:

Tumult Hype’s keyframe-based animation system brings your content to life. Click “Record” and Tumult Hype watches your every move, automatically creating keyframes as needed. Or, if you’d prefer to be more hands-on, manually add, remove, and re-arrange keyframes to fine-tune your content.

As is often the case, I probably payed more attention to pushing the tech, than perfecting the communication.  This was a learning experience, after all.  Take a look and see what’s trending down and what few topics are trending upward.  Click [here] to see the animated infographic.

Birth & Death Rate World Map

This is a rather morbid, but important infographic for two reasons. One, it is important to realize the birth and death rates around the world. What causes an increased birth or death rate in one part of the country? How does our country compare? Why is our country different from another area? Secondly, it is […]

This is a rather morbid, but important infographic for two reasons. One, it is important to realize the birth and death rates around the world. What causes an increased birth or death rate in one part of the country? How does our country compare? Why is our country different from another area? Secondly, it is a great way to show data across the world. I was studying an atlas on the wall in my GRE class, and was amazed by how small the US is. Living in the US, it is even easier to think we have a major impact on the rest of the world, and thus are larger than life. However, we are still just a land mass, and not the largest by far. But this method also shows how little or how large our impact is compared to the rest of the world.

Most people have an idea of what the world looks like in their heads, even if they don’t know where each country is, they know which areas are suffering and which areas are comparatively doing well. They can look at a map and point to Africa or Asia and say that much of this area is very poor, and point to North America or Western Europe and say much of this area is comparatively wealthy. However, what is the impact of this wealth, or lack there of? One can assume it is positive, but not always. I wonder what a similar infographic would look like that shows pollution, or obesity. Would we then fare so well?

Challenge your students to create an infographic about what interests them in this way. How many clothes come out of each country? How many cars are owned per capita in each country? This will really show how well each country lives or how poorly each country lives.

Blog: http://visual.ly/birth-death-rate-word-map

Conference Gear – ISTE Photo Walk

This blog post is going to be in two installments.  This first one is my opportunity to share my gear, but also to promote ISTE’s 5th annual Photo Walk / Photo Safari.  Organized by Apple Destinguished Educators (IDEs), the gathering and 8:00 AM to 10:00 AM on Sunday.  I attended last year’s more extended walk in San Diego, and from that, I’d recommend a health application of sunblock.  Here are photos taken during that walk.

This year, I’ll be taking the following gear as of now.  Main tool will be a Nikon D5100 (more camera than I deserve) with 24-120 and 55-300MM Nikon lenses.  You also see a remote for taking those sensitive low-light shots where camera movement is death to the end product.  It also comes in handy for HDRs, which abuse, admittedly.

David Warlick's Gear Gathering for the ISTE13 ADE Photo Safari in San Antonio on June 23 2013 There are also an unglamorous assortment of filters, and a variety of methods for getting photos from camera to computer (or iPad).  You can also see two embarrassingly low capacity and slow memory cards.  

For my iPhone 4 (older iPhone 3GS standing in), I’ll have a miniature tripod, mostly because I can.  There is also an alternative and easier to attach tripod mount and an ōlloclip, which is a very cool lens set for iPhonography.  Most of the umpgh in my iPhone is in the apps, my favorite of which are Snapseed, TiltShift, Pro HDR, AutoStitch and ToonCamera.

Go here to register for the ADE ISTE Photo Safari 2013.

Top Ten Tips for Attending ISTE 13

This article was first posted on June 17, 2012 for ISTE 12

Everyone is posting their dress and packing tips for the coming International Society for Technology Education conference – ISTE13. So I, as a professional conference go’er, thought I would contribute ten more tips for ISTE in Texas.

  1. San Antonio is cold this time of year, so wear heavy clothing. Dress in layers, because conference centers are notoriously hot. You’ll be doing lots of walking so wear boots, big ones, with lots of laces – Unless you’ve brought heals.
  2. You’ll want to take lots of notes, so carry several spiral-bound note books. Also carry pencils — #2s. If you can find them, use white or aluminum grey pencils. They’ll impress the people sitting near you.
  3. In the presentation rooms, be careful not to sit near anyone with a computer or tablet computer. They have almost certainly left their email notification alarm on, and when it goes off, everyone will turn around and look — at you! If someone with a computer sits near you, get up and find a more secluded spot.
  4. If possible, sit on the front row and straighten your legs out as far as possible. This is where the boots come in, because presenters love to navigate obstacle courses while presenting.
  5. The exhibit hall is the reason you came. There’s treasure here. It’s also a great place for play. Pretend you’re invisible. Wearing a dark cap will help. If you can achieve invisibility, then you’ll have the run of the hall. Simply walk into any booth and pick-up all the pens, pencils, letter openers, and soft fuzzy balls you can find, and slip them quietly into your bag–preferably a large brown paper bag. Chocolate is an especially treasured item and worth a return for more. If someone in a booth confronts you, then carefully put the pencil back on the table, look down at the floor and slowly back away.
  6. You’ll see areas in the conference center with comfortable chairs, where people will be milling, talking, and showing each other their computers. Shun these places. The people will try to brainwash you.
  7. If someone approaches you, wanting to talk, then turn invisible. If this doesn’t work, then look very stupid. You’ll need to practice this in front of a mirror. If they persist, then speak gibberish and walk away.
  8. If you hear anyone speak with an English accent, don’t believe anything they say – no matter how intelligent they sound or cute their accent. This goes double for Australians and New Zealanders.
  9. When the day is over, or by 4:00 PM, which ever comes first, flee back to your hotel room. This is the real challenge of conference-going, finding things to do in your hotel room. I like to remove the lids of shampoo bottles and guess their scent. Also, the extra blankets in the closet are expressly provided for the construction of elaborate blanket forts. ..and I hope that you are a fan of “Law and Order.” It will be playing during your entire visit – on at least three channels.
  10. What David really wants you to do is be comfortable, hungry to learn, ready to laugh and willing to cry, tweet your heart out and hashtag with #iste13, take every opportunity to meet someone new, and wear something strange. I like those satin slippers with toes that curl up and a tiny bell on the end.

If I see you at ISTE13, please forgive me if I’ve forgotten your name. I’m way past the need for excuses.


100 Years of Change

Argumentatively, more has changed in the past 100 years, than in any 100 year period before, as this infographic shows. The first step in teaching this infographic, and teaching any part of history, is to consider the cause and impact of these changes. While most students, and many administrators, may argue the unimportance of studying […]

Argumentatively, more has changed in the past 100 years, than in any 100 year period before, as this infographic shows. The first step in teaching this infographic, and teaching any part of history, is to consider the cause and impact of these changes. While most students, and many administrators, may argue the unimportance of studying history, at least in comparison to other subjects related to technology. However, these technologies have shaped the past 100 years, and it is important to understand the past impact of these technologies, in order to understand the future impact of other technologies.

In addition to the importance of history, it is important to teach it in the best way. Aside from citing the year 1913 to compare (being exactly 100 years ago), there are no dates mentioned in this infographic, and yet the importance of this infographic is still obvious. It shows the impact that 100 years has made. When I was in grade school, just 10 years ago, The most important things I was taught were the dates of major events, and a little bit about the impact. While a general idea of the dates is important (knowing that The Civil War happened after The Missouri Compromise) the exact dates are not terrible important. The most important part of history is understanding the importance of a certain event (that The Missouri Compromise put off The Civil War, but recognized the increasing tensions).

While a the knowledge of a detailed history of the United States is not important for many fields, understanding the impact that people and events have made on this country is very important. If one of your students decides to go into software development of some sort, in order for them to develop the best software possible, they must understand the past impact of other technologies. What was the impact of the discovery of electricity and the following development of the lightbulb? How have people’s lives changed for good, and for bad, as electronic devices increasingly took over our lives? How can this particular student develop software that can mend the transgressions of previous technologies, but still create a positive impact on our future?

Blog: http://visual.ly/100-years-change

Ten Most Spoken Languages

When your students are deciding what language to specialize in, this infographic may come in handy, and may hold some surprises. This infographic shows the ten most spoken languages in the world, and where they are spoken. However, students shouldn’t just factor in the most spoken language all over the world when they choose a […]

When your students are deciding what language to specialize in, this infographic may come in handy, and may hold some surprises. This infographic shows the ten most spoken languages in the world, and where they are spoken. However, students shouldn’t just factor in the most spoken language all over the world when they choose a language, they should also factor in where they will be speaking the language? Will it just be here in the US, or are they going to travel. And don’t forget to remind them, they can always learn a new language as their dreams change.

First of all, it was interesting to discover that English is not the most spoken language. It is easy to assume that every educated person in the world has learned English, but English fell to number three, after Chinese and Spanish. With the Chinese increasing in their power across the world, this would be a good language to learn if your students plan to go into international business, if they were willing to put in a great amount of effort. Also with so many Spanish immigrants coming into the United States, this would be a great language if your students planned to work with the general public.

It is also interesting to speak with students from other countries and find out what languages they learn. I visited a peer in Germany when I was in high school, and was amazed to find out that these students were learning their third, and even fourth language, when I hadn’t even mastered a second. Challenge your students to become bilingual, to be esteemed by their peers in their future endeavors, and if they plan to travel, to be a more acceptable tourist.

blog:http://goo.gl/bN7JV