Web Generation Uses Libraries…

newsobserver.com | Web generation uses libraries more than others:

Young adults are the heaviest adult users of public libraries, despite the ease with which they can access a wealth of information over the Internet from the comfort of their homes, according to a new study.

Library ShelvesThat was the opening paragraph from an article that appeared in today’s Raleigh News & Observer, attributed to Anick Jesdanun of The Associated Press.  According to the article, 21% of Americans between the ages of 18 and 30 have turned to their public libraries for information, as opposed to only 12% of the general adult population. 

The data comes from a joint study by the Pew Internet and American Life Project and the University of Illinois at Urbanna-Champaign, and indicates that younger adults go to their libraries for “Education-related tasks,” including making decisions about schooling, getting job training.  The study also found that Library use drops gradually as the ages increase, with a fairly sharp decline at around 50 years of age.

Lee Rainie, Pew’s director, said, “It was truly surprising in this survey to find the youngest adults are the heaviest library users.”

Wren, 31 Dec 2007. “The Endless Library.” H. Wren’s Photostream. 14 May 2005. <http://flickr.com/photos/hypowren/13897466/>.

2007: I pictorial Review

I saw a short pictorial review done by Ewan Macintosh yesterday, and it seemed like a good way to bring 2007 to a close. Little did I know how hard it would be to pick just the right shots from 2,074 pictures in my iPhoto from the last 12 months. So scroll through quickly if you have only a few minutes.

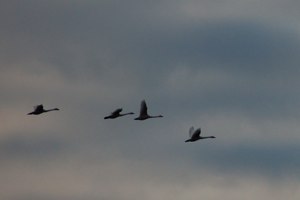
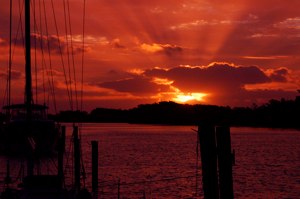
It started with Brenda and I taking a trip to Lake Waccamaw, in eastern North Carolina — nesting sight for the great Canadian Swans.  It was a magnificent trip, where we both got lots of shots and I got a chance to try out my new telephoto lens.Below is an early morning sun rise from the pier just in front of the small house we rented in Beaufort for the rest of the week.  I’m not sure I cracked the lid of my laptop more than three times the entire trip.

I can tell already that this is going to be tough, pulling out just the very small handful of photos that define the year for me.

Canadian Swans
sunrise in beaufort
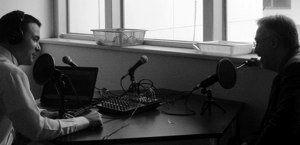
Jeff Utecht and I recording a podcast at the Shanghai American School.  It was a fantastic week of working with international school educators, and getting a taste of the future, China.  We had lots of meetings, a few workshops, and the week culminated with what was probably the precursor to the Learning 2.0 conference, which occurred about six months later. Jeff and I doing a podcast
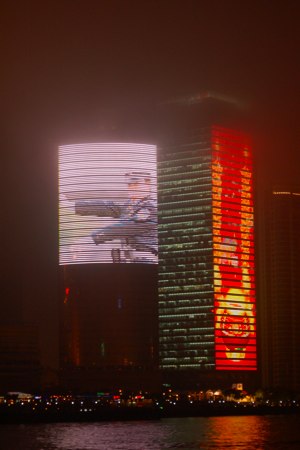
Shanghai was quite a place to visit.  I took the picture to the right the last day (evening) that I was in the city.  Me and two art teachers, a tech person and her husband, a business student from Japan spent the evening eating, watching an amazing cultural dance show, walking in the Bund, and trying some exotic drinks that you can’t get in the U.S. Shanghai
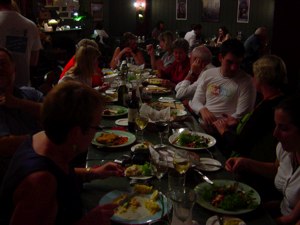
Only a few days and about 20,000 miles later, I’m having dinner with new friends in New Zealand.  I spoke at their educators conference in Rotorua and then traveled down to the South Island to Dunedin for a day-long workshop.  Many newer friends and a day of walking around town taking lots of pictures.  I also got to see my first Rugby game.This was one of several opportunities that I had, during 2007, to see what educators can do with these emerging new tools, when they have permission to just “do it!” Dinner with friends in New Zealand
I was in Fredericton, New Brunswick, Canada twice in 2007, making lots of new friends.  Just like New Zealand, it was a charge to present my ideas to educators who could actually run with it.  I could see in their faces, that they were working out how to make this work in their classrooms, rather than how they might get permission to make this work.I also spent a day with my friend Jeff Whipple, who took me to his uncle’s maple syrup farm.  Great fun, and I got to take some home with me.  The security folks at the Fredericton airport were just great. Fredericton, NB
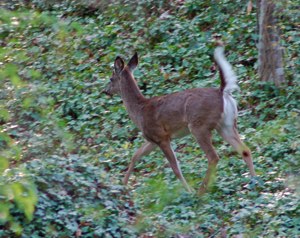
It was around this time that we discovered a small herd of deer who live in our neighborhood.  We are not inner city, but its several miles out, before you get to anything that resembles wilderness.  There are a lot of trees and parks in Raleigh.  It’s one of the best things about this city, that we have fought to keep, despite efforts to make it easier for developers to do their thing without regard to aesthetics. Backyard Deer
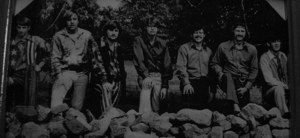
I played one gig with some of the folks I use to play music with when I was in high school.  One brought this photo that we all posed for in 1969.  I’m the tall one to the left.  My mom made that shirt for me. Liberty Arc
This was a wonderful day in Toronto, with the approaching spring.  I worked with the Ontario Library Association to brainstorm about a new set of instructional standards for school libraries.  The Ministry of Education wants the school libraries to take the lead in moving schools toward 21st century teaching and learning. Toronto
From Toronto, I flew to Boston to meet Brenda and Martin for a couple of days of doing the history thing.  It was a lot of walking and some great food and the sort of thing that Brenda and I will likely be doing more of.  She’s going with me to the UK in March and likely to Vancouver later on in the year.  She knows way more about English history than I do. Brenda in Boston
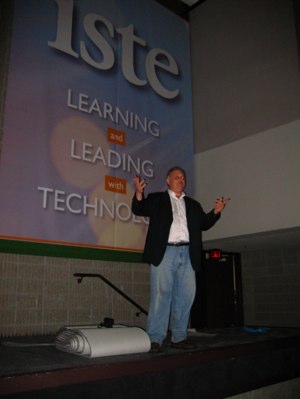
Then came NECC in Atlanta.  Here’s David Jakes delivering the keynote address at this national conference.  Actually, we both got there early, and staged this shot.  He looks like a natural, don’t ‘e.It’s difficult to say what the high point of this conference was, without seeming to disapprove, in some way, of other aspects.  NECC 2007 was, hands down, the best National event I have ever attended.  You could hardly turn around without bumping into some opportunity to learn something new.  The sessions and keynotes were great, and the in-the-hall opportunities were phenomenal. Jakes' Keynote Address at NECC
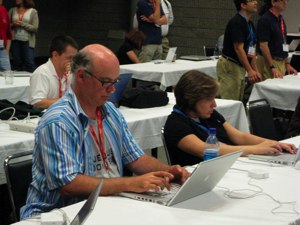
Certainly, one of the best things about NECC2007 was the EduBloggerCon [photos], organized by Steve Hargadon.  It was a day of conversations among practitioners who all had something to teach and all had much to learn.  This was learning 2.0. EduBloggerCon
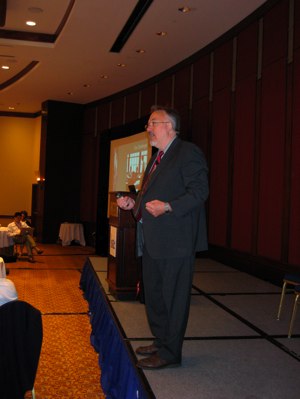
This was one of the presentations I did at NECC, talking about the fundamental characteristics of Web 2.0 and its pivot points of opportunities for education.  The audience was state level directors of technology, the State Education Technology Directors Association (SETDA). Me Talking at NECC
Here is one motley crew of educators — at the end of the NECC conference.  We were asked to share some reflections about the event.  I had just finished my spotlight address and had completely forgotten about this webcast.  Someone had to come and fetch me.  Not at all out of character for me.The folks with me, from left to right are Steve Hargadon, Will Richardson, me, and Chris Walsh.  You can see the web cast here. A Motley Crew at the end of NECC
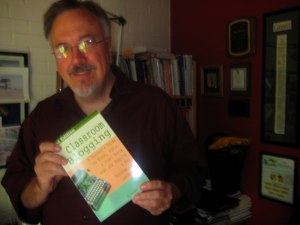
It was shortly after NECC that I finished the 2nd edition of Classroom Blogging.  May is always a light month for me and it seems that there is always some big writing project that is begging to be done then.  The response from the book has been good, but I was most validated when Brenda told me that “This is a good book.  Teachers should read this book.” Classroom Blogging 2.0
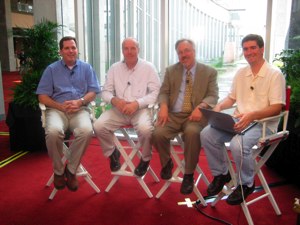
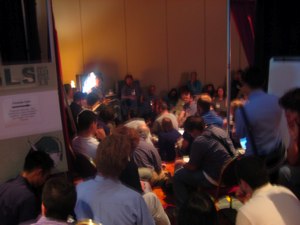
During every year, since I have gotten involved in education and technology, I have witnessed lots of highlights.  But certainly, for 2007, one of the greatest of these was the Games, Learning, and Society conference in Madison, Wisconsin.  I learned more about the future o education here than any other event all year.  In this picture, we’re all sitting around a fire (digital) and discussing education and video games with Dr. Henry Jenkins of MIT.One thing that impressed me here was that most of the presenters looked like they were 17 years old.  Yet, they were all fantastic, entertaining, knowledgeable, and committed speakers.  I learned so much! Fire side chat with Henry Jenkins
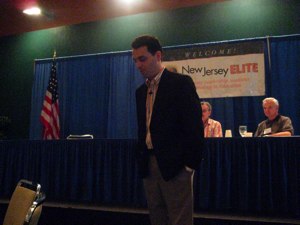
Another highlight was the two times that I got to speak at the same conference with Daniel Pink, author of The Free Agent Nation and A Whole New Mind — both books are about me.  This was the New Jersey ELITE conference for education administrators from across the state. Daniel Pink
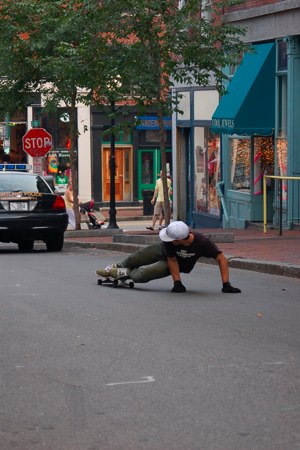
The second time I got to work with Daniel Pink was at the Council for Chief State School Officers in Portland Maine.  It was an exciting conference, but the best pictures came from a series I took of some youngsters who were skateboarding down a hill in downtown Portland with special gloves.  Great fun, and a wonderful city.  Brenda met me here and we both fell in love, wishing we’d stayed here rather than going up to Bar Harbor — which disappointed us both. Skating in Portland, ME
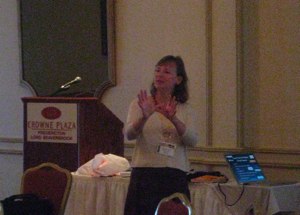
Back in Fredericton, New Brunswick, I got to see Sharon Peters again where she spoke to a packed house about Web 2.0.  She is so smart and also very relaxed.  She tried to teach me a little French — which I bungled during my keynote. Sharon Peters in New Brunswick
Intermixed among these highlights were lots of gigs (lots of gigs) that all contributed to the buzz that was 2007.  Lots of presentations and lots of conversations — lots of learning.  But this one stands out, because of this very tech savvy educator in Kinston, North Carolina, who, after I showed pictures of my avatar in Second Life, proceeded to set up her account and move into EduIsland before I finished my presentation.It took me three months to get off of orientation island. Second Life in Kinston, NC
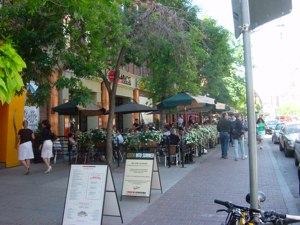
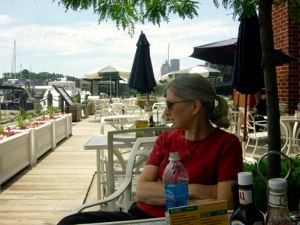
Twice Brenda and I went to New Haven, Connecticut, flying into NYC, and taking the train up to this very beautiful town.  Brenda wondered the town, reading at coffeeshops and exploring the shops while I drove off to neighboring towns to do my presentations.Our hotel was right on the edge of Yale Universities Campus, so the atmosphere was right down our alley, with lots of ethnic restaurants, and some of the best pizza we’ve ever eaten. Yale...
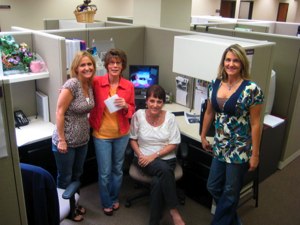
This is a magnet school in Los Vegas and you see, here, the science department.  The school is virtual, and the teachers teach from these cubicles, reaching out to students all over the county and beyond.  It intrigued me that this type of teaching would have seemed impossible to even imagine when I graduated from college. The Science Department
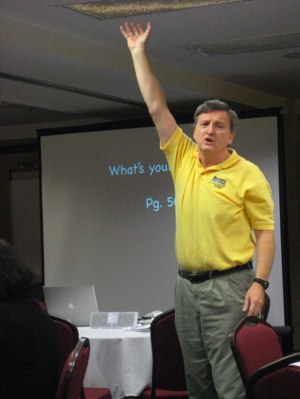
Another high point was watching my friend, Joe Brennan, present about digital video and digital storytelling in Pennsylvania.  He is a talented presenter and the entire audience was captivated the whole time.  And Joe really is that tall! Joe Brennen doing a digital video presentation
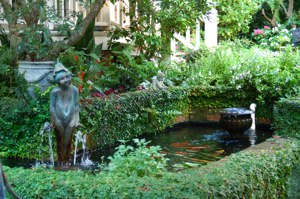
During one of the rare weekends that I was at home during the fall, Brenda and I went on a tour of gardens in Raleigh.  We felt so much like my grandparents.  Made me want to retire. 😉 Garden Tour
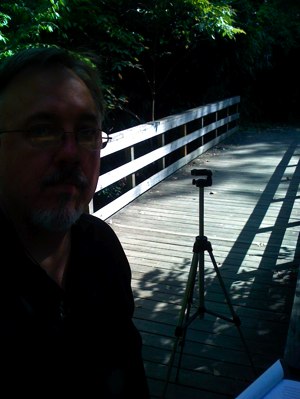
I took this quick shot while preparing to do one of the scenes from my 2007 K12Online conference keynote.  I made it no secret that this is a hard thing for me to do, to work before a camera, especially when it’s my camera.  But the chat that ensued during the first 24 hours of the conference as people where watching the keynote was incredible to me.  It was like being able to watch my own presentation through the eyes of others and engage in conversation with them — all at the same virtual time. K12Online Keynote
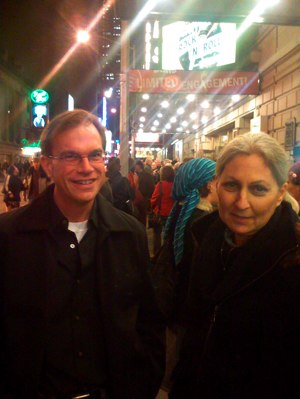
After one of our trips to New Haven, Brenda and I met my youngest brother, Dennis, in Manhattan, where we took in a play.  It was supposed to be a fun play about Rock’n’Roll, but turned out to be very serious and a great play.  I got some great pictures of the very old and stately theater in side, but this one captured the moment. Waiting for Tickets in NYC

All in all, it was a good year during which we saw some issues that had been emerging of the past few years, start to mature in some interesting ways. Maturing is not always fun, but it is what we work toward, and it is work.

Happy new year to you all!

The Value of Knowledge

For years, Brenda and I have preferred shopping at Circuit City for our electronics desires — over competitor, Best Buy.  I’ve felt that their sales staff have always been more knowledgeable and more eager and skilled at serving customers.  However, this year, it seems to have flip-flopped.  Several weeks ago, I was forced to visit Best Buy with a gift card I’d received weeks earlier, and was surprised and pleased when sales people seemed to have answers, or quickly found other staff who did.  It was a surprisingly pleasant and educational experience.

Circuit City, on the other hand. seemed to have fallen with fewer salespeople, and more often than not, looks of confusion when I described what I wanted.  Twice, I asked for a product, and when it was clear that they didn’t know anything about the concept, insisted that they didn’t carry it — both of which, I found with a little extra looking.  I bought both at BB.

The whole story became clear this morning, when I ran across this (Circiut City’s Shares Tumble after Loss Widens) from the Washington Post, a story that was more succinctly described (Santa Clause Comes for Failed Business Executives) by Beat The Press commentator, Dean Baker.  Baker writes that…

The basic story is that last March, the wise men who run Circuit City came up with the brilliant idea of laying off their more senior salespeople, who get $14-$15 an hour, and replacing them with new hires who get around $9 an hour. It turns out that this move was not very good for business. One of the reasons that people go to a store like Circuit City, rather than buying things on the Internet, is that they want to be able to talk to a knowledgeable salesperson. Since Circuit City had laid off their knowledgeable salespeople, there was little reason to shop there.

Read more about the impact that this decision has had on business at CC.  It isn’t a pretty picture, nor does it speak well when vice presidents for the company are receiving million dollar retention bonuses.

But the point, to me, is what this story indicates about the value of knowledge and the ability to serve with knowledge.  I’m not sure how this might impact classrooms, beyond a nifty little anecdote to tuck away for a rainy instructional day.  I think, for me, it makes the point that the value of knowledge is not in the sake of the knowledge, but in how you can use it to serve — to accomplish goals.  It’s why it is so important that students learn in ways that are authentic to the knowledge, and, especially, that their mastery is assessed in ways that are authentic to the knowledge.

Two more pennies reaching for the end of another year.

Google Chart API

Warning: This post rates pretty high on the geek index.

Google Graph of CB BlogsI started to blog about this a few weeks ago, when I first ran across it. But realizing that I am probably the only person I know who would get excited about something like this, I decided to put it aside. However, after spend a few hours this morning playing around with Google’s Chart API, I simply can’t resist.

It’s a tool, of sorts, that allows you to generate graphs based on your own data. It’s a little geekie to work with, but very cool and perhaps a little useful. To the right is a graph, generated by Google’s Chart API, that illustrates the number of blogs posted to Class Blogmeister by the week over the past 12 months. The data comes directly from the site’s database, so it is dynamic. But it is possible to generate basic (and complex) graphs simply by adding values into a URL.

Here’s how it works:

The graph is driven by a URL. As an example:

http://chart.apis.google.com/chart?chs=200x125&chd=t:80,22,97,68&cht=lc&chl=Mar|Apr|May|Jun

This URL is made up of the following arguments:

chs — dimensions in pixels (200×125 means 200 by 125 pixels in size)
chd=t: — data to be charted (the “t:” indicates numeric data, 30, 22, 97,68)
cht — is the type of chart (lc mean line chart)
chl — lists the chart labels, which align with the chart data.

http://chart.apis.google.com/chart?chs=200x125&chd=t:80,22,97,68&cht=lc&chl=Mar|Apr|May|Jun

Copy the URL above and then pasted in the address box of a seperate browser window. Then change the numbers after chd=t: and refresh. Change the lc after cht to p3 and refresh. This will generate a three dimensional pie chart.

If you want to embed the chart in your own web page, then simply use the URL as the source for an image. The code would run like this:

You can go into more detail by going to the developer’s guide.

Merry Christmas

D5 from HyOn --
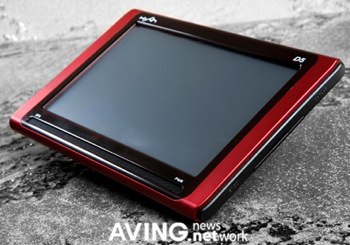
It looks like a somewhat sleeker version of the Etch-A-Sketch I got for Christmas when I was somewhat less than 10 years old.  This puppy, however, sports bott T-DMB and S-DMB, displaying at an astounding 800 X 480 resolution LCD, a SiRFstarIII GPS chipset and two 1.5-watt speakers — and absolutely no aluminum powder.

To bring it down, this is an incredible GPS device that also carries terrestrial and satellite digital multimedia broadcasting.  Alas, Santa only delivered them in South Korea last night.

I don’t know what Santa’s brought me yet.  The rest of the family is still asleep and I’m taking a quick scan of my aggregator,

..and being especially thankful of for my family, my health, my friends — near and far — and for the privilege of living in such exciting times where we all have such a hand in molding the future. 

Do it carefully and do it joyously!

Happy holidays to all of you!


Rose, 25 Dec 2007. “Hyon to Launch Dual-DMB Navigation .” AVING Global News.Network. 22 Dec 2007. NSBS Corporation. <http://aving.net/usa/news/default.asp?mode=read &c_num=68566&C_Code=01&SP_Num=0>.

Grades by Technorati?

I got wind of this through an e-mail from Jeff Whipple and then his blog, which I think speaks better than I could right now.  Jeff writes…

Some edubloggers have been discussing the idea of “social capital”, the premise that the connections you bring to an organization through digital networking can be of significant vale. For instance, would someone like Jeff Utecht, Clay Burell or Karl Fisch, all well-known edubloggers, be of more value to a school just because of the connections they have developed with others?

Now comes word that maybe the social capital or digital fame can be worth marks. Maybe the difference between an A+ and a C can be measured by Technorati? One educator seems to think so.

Read more about Jeff’s take on the Time/CNN article, Googling for Your Grade, from Whip Blog.  It reminds me of a blog post that I wrote back in February, School 2.0 Currency, where I compared the instructional value of asking students to “earn attention” as opposed to asking them to “pay attention”.

Whipple, while recognizing the worth of personal network building, questions the means that some students applied, near the end of the semester, to rack up their “famo” index.  I would agree that these tactics are a matter of concern, though this occurance is consistent with what I hear again and again from teachers of blogging classrooms.  “We’re having, in my classroom, conversations I’ve never seen before in my ## years of teaching.”  They are opportunities for tackling issues, and, in this case, exploring the differences between a big network and a valuable network.

Thanks, Jeff!

And Happy Holidays to Each of You!

Take Language Away from a Human, They End Up Looking just like Monkeys

This is not a joke.  Researchers at Duke University refined a study conducted by Japanese scientists earlier this month that found that young chimpanzees were better at memory games than human adults.  The Duke study was the first that examined whether or not non-human primates could make explict decisions that were based on mathematical calculations.

The study:

Smart Monkey
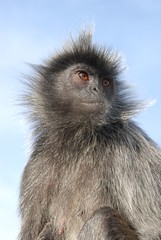
…pitted the monkey math team of Boxer and Feinstein — two female macaque monkeys named for U.S. senators Barbara Boxer and Dianne Feinstein of California — with 14 Duke University students.

“We had them do math on the fly,” Cantlon said.

The task was to mentally add two sets of dots that were briefly flashed on a computer screen. The teams were asked to pick the correct answer from two choices on a different screen.

The humans were not allowed to count or verbalize as they worked, and they were told to answer as quickly as possible. Both monkeys and humans typically answered within 1 second.

And both groups fared about the same.

The chief researcher, Jessica Cantlon, said that their work was not designed to show up Duke students, but to learn more about where human thinking comes from.

Steenhuysen, Julie. ” Monkeys and college students as good at mental math.” Yahoo! News 18 Dec 2007 21 Dec 2007 <http://news.yahoo.com/s/nm/20071218/lf_nm_life/chimps_math_dc;_ylt= ArxogtuC2vJLH3VhfZAaRMEDW7oF>.

Shouse, Dan. “Monkey Disdain.” Dan Shouse’s Photostream. 22 June 2006. 21 Dec 2007 <http://flickr.com/photos/danshouse/172499184/>.

Technorati Tags:

Percent of Teens Producing Digital Content is Up

Just in from the PEW Internet and American Life Project, more teens are producing digital content.  I’m commenting on the front page summary in this article.  You can download the entire PDF report here.

Pew Internet: Teens and Social Media:

Content creation by teenagers continues to grow, with 64% of online teenagers ages 12 to 17 engaging in at least one type of content creation, up from 57% of online teens in 2004.

I’m going to have to change one of my presentation slides to reflect this.  It’s still a controversial and controvertible, especially as I compare it to their teachers digital content creation.  I think that the point remains, however, that many of our students are, in some ways, more literate than many/most of their teachers.

Graph of Girls and Boys Production of Digital Content
I made this graph from the data using Excel…

Girls continue to dominate most elements of content creation. Some 35% of all teen girls blog, compared with 20% of online boys, and 54% of wired girls post photos online compared with 40% of online boys. Boys, however, do dominate one area – posting of video content online. Online teen boys are nearly twice as likely as online girls (19% vs. 10%) to have posted a video online somewhere where someone else could see it.

Hmmm!  I’m not even going to try to comment on this, except to say that of the three, my son makes videos, and my daughter uploads digital photos to her Facebook profile.

The survey found that content creation is not just about sharing creative output; it is also about participating in conversations fueled by that content. Nearly half (47%) of online teens have posted photos where others can see them, and 89% of those teens who post photos say that people comment on the images at least “some of the time.”

It could be that this is the tendency that has the most potential to us, as educators — that teens use their digital media as a point of conversation.  Of course the wording isn’t earth shattering (people comment on the images at least “some of the time.”), but this all shows a need, among many of our teenage students, to invest themselves in expressing their experience with information.

However, many teen content creators do not simply plaster their creative endeavors on the Web for anyone to view; many teens limit access to content that they share.

This is one thing that I hear from most teens I talk with about their social networks.  They are private/careful to some degree.  But again, we don’t know how much of that is true or how much of it comes from our training them to say what they think we want to hear.

There is a subset of teens who are super-communicators — teens who have a host of technology options for dealing with family and friends, including traditional landline phones, cell phones, texting, social network sites, instant messaging, and email. They represent about 28% of the entire teen population and they are more likely to be older girls.

28% is not an insignificant number.  Consider that as information and communication technologies continue to evolve, the activities of this quarter of the teen population will likely define a larger portion of what they all will be doing in their social and work lives ahead.

What do you think?


Lenhart, Amanda, Mary Madden, Alexandra Rankin Macgill, and Aaron Smith. “Teens and Social Media.” PEW Internet & American Lif Project. 19 Dec 2007. Pew Charitable Trusts. 20 Dec 2007 <http://www.pewinternet.org/PPF/r/230/report_display.asp>.

The Night before Christmas — Mac-style…

Reading a Christmas Tale
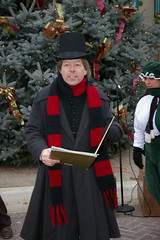
Internet Archive: Details: Twas the Night Before Christmas:

The Crippled Macintosh Rehabilitation Clinic is known the world over for its talented yet challenged hardware. Here we hear the vocal stylings of an ensemble of powerbooks, the Crippled Macintosh Rehabilitation Choir, reading a classic Christmas tale.

Admittedly, I didn’t listen to the whole thing, but I know how it ends.  Available on Archive.org (which seems to be back, to my Twitter followers), is non other than the Crippled Macintosh Rehabilitation Choir.  I just wanted to type that again.  It’s all the available Macintosh voices (in 1994) arranged and edited together (before Garageband) to tell the delightful Clement Clark Moore tale.

It’s available here as a straightforward MP3 file, but you can also download it in a variety of other ways from the Archive page.  Best enjoyed with chestnuts roasting.

[audio:http://www.archive.org/download/org.resource.public.twas/crippled_macintosh_rehabilitation_choir_vbr.mp3]
Jones, Wigwam. “Village of Holly Dickens Festival 2007.” Wigwam Jones’ Photostream. 1 Dec 2007. 20 Dec 2007 <http://farm3.static.flickr.com/2102/2079545320_0d3de27977_m.jpg>.

Candidate Clouds

Candidate Debate Tag CloudsJust finished a very cold mile walk (23f/-5c) to the coffee shop where, after warming my hads around a tall decaf, I’m writing about tag clouds.   In looking for examples, I ran across Pollster.com, where they have posted two blog entries that include tag clouds of the presidential debates.  On April 27 they included the democratic contenders, and on May 4, they posted the republicans’.

It’s interesting to compare Clinton’s cloud with those of the other candidates.  She has very few big words, meaning that there are not a lot of words and terms that she uses repeatedly.

What does this say about the candidates?  Is this a useful tool for analyzing and comparing our choices?  Certainly not in its self. 

But what might students learn if they could generate tag clouds for the chapters of their textbooks?

Check out TagCrowd (http://tagcrowd.com).