A Few Tweets from Leaders

The best part of this October from hell is the conferences I am working – mostly leadership conferences. The two that come to mind from the blur of this most haunting month are a conference in Vancouver for principals and vice-principals of British Columbia, and the school boards and superintendents’ conference in Vermont – two quite interesting jurisdictions now that I think about it.

As I write this, I am in Tokyo’s Narita Airport, waiting on my third and final day of travel to Kuala Lumpur (KL) Malaysia.  It’s EARCOS’ annual leadership conference, which was canceled last year because of flooding in Bankok.  The flooding is happening closer to home now, with Sandy bearing down on New Jersey and New York, where my kid brother lives – on the ground floor of his building I might add.

During all of the travel, I have enjoyed and learned from the backchannel transcripts from BC, Vermont and also an amazing media and ed tech conference in Winnipeg.  As I’ve read and commented on the transcripts, via KnitterChat, I have set aside some tweets and knits, that seemed especially salient to me, intending to re-tweet them back out.  With my spotty Internet access (paying by the minute at the Hilton here in Tokyo), they’ve back up.  So I thought I would push them out through this blog.  So…

This was my response to a tweet from the Vermont conference.

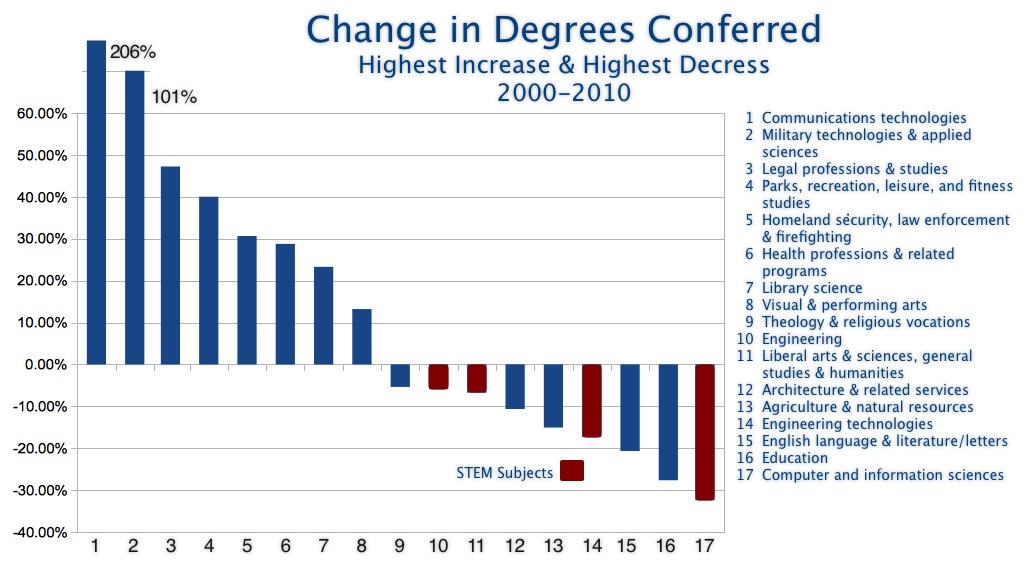
The Graduates of today’s education need to be uniquely valuable, not identically valuable.

Here’s one that came at the mention of learning disabilities.

..often, a learning disability is not so much a difficulty in learning, as it is a difficulty in being taught.

Tinkering and the whole DIY movement came up, as it increasingly does, as a counterpoint to all the social networking and video games kids engage in.

When was the last time you made something. Can you make something without learning something?

What is unique and fresh about Vermont is that they seem honestly enthusiastic about the future of education there.  Vermont is different from the rest of the U.S. in so many ways, and they do not seem to feel so confined by national trends and federal mandates as the rest of the country.  From talks of testing, this statement surfaced.

We don’t ask enough questions for which we don’t know the answers.  We should respect our learners that much.

That Vermont’s backchannel was so prolific surprised me.  It is rare that school board members and superintendents are so chatty when their statements are publicly accessible.  I added this in…

I’m wondering how many of your schools’ stakeholders are following your conference tweets.  It’s an interesting idea.

It wouldn’t be a bad thing, from my reading.

While in Vermont, I sat in on a great presentation by superintendent Dan French.  I was, in no small part, intrigued by the fact that he did his presentation with a Linux computer.  Cool thing, a techie super.

He talked about their process for establishing a district vision for 21st century learning.  The session was called “Making Community Part of 21st Century Learning Vision” and I posted my notes (taken with the Mindo iPad app) here.  Basically, he played selected videos from Youtube for members of his volunteer visioning group, including Sir. Ken Robinson, Dan Meyer and one about New Brunswick’s education, and then asked groups to discuss.

He said that even attendees who were usually critical of the school system bought in.  French reported that one critic commented, “I didn’t you you talked about issues like this!”

A School that Practices Learning-Literacy

I had the pleasure and good fortune of speaking at the Connecting Leaders conference this weekend in Vancouver. Organized by the British Columbia Principals and Vice Principals Association, the conference consisted of two days of keynotes, breakouts and meetings.  I keynoted the second morning (Saturday), delivered a breakout and the closing remarks around 11:30.  Pretty standard fair.

After the conference adjourned, the association held an Educational Leadership Forum to assist in revising their Leadership Standards for Principals and Vice-Principals in British Columbia.  Eight panelist were invited to deliver 7 to 8 minute talks, exploring specified topics that are relevant to school leadership.  I was panelist number seven and was asked to talk about literacy.

The panelists were:

  • Dr. Bruce Beairsto — Former Superintendent of Schools with the Richmond School District in British Columbia
  • Dr. Avis Glaze — International educator, speaker and former administrator with the Ontario Ministry of Education
  • Julie MacRae — Director of Education/CEO of Regina Public Schools, Saskatchewan
  • Dr. Kim Schonert-Reichl — an Applied Developmental Psychologist and Associate Professor at the University of British Columbia
  • Dennis Sparks — Emeritus Executive Director of the National Staff Development Council
  • Robert C. Kidd – President of Overwaitea Foods
  • Dr. Charles Underleider — Professor of the Sociology of Education at The University of British Columbia
  • David Warlick – In high cotton 😉

The event was brilliantly organized with eight round tables in the room, each devoted to two of the addressed topics.  Around each table were invited and distinguished principals, vice-principals, district administrators, university folks, and representatives from the BC Ministry of Education.  Four of the panelists spoke on their topics and then the eight of us dispersed to our assigned tables where we discussed our first assigned topic.  Then the remaining four returned to the stage to address our topics.

I wanted to share some ideas about an expanded vision of literacy that reflects today’s prevailing information environment –– my standard respelling the 3Rs with a healthy sprinkling of ethics.  A recent teenage suicide in BC, resulting from cyber bullying, was a fairly pervasive backdrop throughout the conference.  But I wanted to go beyond my standard 3Es and try to describe what I would expect to see in a school that practices contemporary literacy (learning-literacy).

What really helped was being able to listen to six of my stagemates share their perspectives before I had to speak, each of them provoking a new twist on one or more of the qualities I had listed.  I certainly hope that the frequent tweaking of my notes (see above & right), on my iPad, at my end of the stage, didn’t distract anyone.

So, a school that practices learning-literacy will be a school where

  • The distinctions between teacher and student begin to blur.
  • There is less reliance on textbooks and authority, and more reliance on the work of learning.
  • There is a natural convergence between the rich information skills of literacy and numeracy and the information and data that define the content areas.
  • Teachers teach from new learning, as master learners.
  • Digital Footprints become a central part of the school’s culture, building evolving personal and school identities based on learning and “doing” with the learning.
  • The library magnifies the world outside, but also reflects the culture inside, curating collections of learner produced media products.
  • Where learners learn, teachers model learning, and the school teaches the community.

How does this ring for you?

The formation of a galaxy.

A disk galaxy to be specific. This is an easy to consume video animation that depicts the formation of a galaxy much like our own. This video got me digging through wikipedia about the universe and it’s pretty astounding. Astounding is a little bit of an understatement considering I’m talking about the biggest and most […]

A disk galaxy to be specific. This is an easy to consume video animation that depicts the formation of a galaxy much like our own. This video got me digging through wikipedia about the universe and it’s pretty astounding. Astounding is a little bit of an understatement considering I’m talking about the biggest and most mysterious thing we know of. Even if you just concentrate on a single galaxy you’re going to get overwhelmed at just how much stuff you’re looking at within that galaxy. This place is huge.

The formation of a galaxy.

US Elections- 100 years

In recent years, elections have been extremely close, the final results often not being known for days, and even weeks after the election. Recounts have been common, and debates over the true winner have lasted for months. This infographic takes an unbiased look at elections passed and shares the outcome of them. This infographic takes […]

In recent years, elections have been extremely close, the final results often not being known for days, and even weeks after the election. Recounts have been common, and debates over the true winner have lasted for months. This infographic takes an unbiased look at elections passed and shares the outcome of them.

This infographic takes every election since 1908, and shows how each state voted. It also uses pie charts to compare the electoral votes and the popular vote. The infographic goes a step farther and summarizes the issues in each election. This is a great summary of every election in this century, and would be a great resource for years to come.

Use this infographic to discuss with your students the history of the country and how this has affected elections. For instance, what does each political party stand for, and how people may have thought the candidate would help what was going on. Also, talk about what each president did, how happy people were with them, and how this lead to reelection or not.

Blog: http://visual.ly/us-elections-100-years

Are We Declaring the Wrong War

Last Wednesday, The New York Times posted an op-Ed piece by Justin Hollander. The Tufts University professor drew attention to U.S. Secretary of Education Arne Duncan's declaration of “war on paper textbooks,” and his call to replace them with a “..variety of digital-learning technologies, like e-readers and multimedia Web sites.”

Hollander continues,

Such technologies certainly have their place. But Secretary Duncan is threatening to light a bonfire to a tried-and-true technology — good old paper — that has been the foundation for one of the great educational systems on the planet.1

This common reaction to our move to digital and networked education is yet another exasperating example of our apparent need to define education by where it happens and the objects we handle to accomplish it. The assumption persists that education is to be administered through the proper and efficient application of technologies, regardless of their century of origin –– and that the publishing industry is best qualified to prepare and distribute the services of those technologies.

What's at stake is not what children carry into their classrooms, but it's the experiences that they take part in and what they carry away from those experiences.

My hope is that Secretary Duncan's war is not with paper, but with a one-way street style of education that revers the source and delivery of knowledge at the expense of our students' essential partnership and investment as they learn and master the practices of lifelong learning.


1 Hollander, J. (2012, October 10). Long Live Paper. The New York Times. http://www.nytimes.com/2012/10/10/opinion/long-live-paper.html?_r=0


A new way to multiply.

Well I’m not sure how new it is, but it’s something I’ve never seen before. Apparently this method is popular in Russia and Japan. It’s pretty self-explanatory in the video yet it’s hard to figure out how someone came up…

Well I’m not sure how new it is, but it’s something I’ve never seen before. Apparently this method is popular in Russia and Japan. It’s pretty self-explanatory in the video yet it’s hard to figure out how someone came up with this method that works so well.

A new way to multiply.

Tsunami Smart

There are many types of natural disasters that can damage the way we live. Between storms from the sky, and a constantly moving Earth, it is nearly impossible to escape these natural disasters. A tsunami is one that is particularly devastating. It begins with movement of Earth, and ends with a large wave, both with […]

There are many types of natural disasters that can damage the way we live. Between storms from the sky, and a constantly moving Earth, it is nearly impossible to escape these natural disasters. A tsunami is one that is particularly devastating. It begins with movement of Earth, and ends with a large wave, both with massive destruction.

This infographic shares the basics of tsunami’s. There are three main ways that a tsunami starts, an earthquake, a landslide or a volcano. The infographic does a great job of showing how these three can begin a tsunami. The infographic then shows characteristics of a tsunami.

With your students, do research on tsunamis. What are some ways that tsunamis can be predicted? How long in advance can they be predicted? Research devastating tsunamis throughout history. Do research to see if you all can come up with preventative measures.

Blog: http://visual.ly/tsunami-smart

You Know You’re in Maine When…

Portland Head Lighthouse (HDR)

Haddock Stuffed with Lobster, mashed potatoes and roasted carrots (chocolate cake not shown)

Wordle of Twitter Backchannel Feed

Stitched Panorama of General Session

On Wednesday evening, I enjoyed a great dinner and warm fellowship with ACTEM’s MAINEducation conference committee (ACTEM is Association of Computer Technology Educators of Maine).  They were celebrating their 25th conference and the 10th anniversary of the state’s celebrated 1:1 initiative.  We met at Slates in Hallowell, as I had not yet gotten to my hotel –– having meandered up from Portland, looking for lighthouses to photograph.

Leaving the restaurant, after a satisfying meal (code for filling), I dashed across the street to my rented Kia, remounted my Garmin GPS, typed in the address of the hotel and started driving.  It was dark, wet, and black, the blackness that comes with wet streets that swallow light rather than illuminate what’s in front of you.  So it was one of those slow drives that had me focused primarily on Lady GPS saying,

“TURN RIGHT – HERE!”

or

“TURN LEFT – HERE!”

I’d gone through about twelve of these, only three of which resulting from missed turns and the machine’s ,

“RECALCULATING!”

.. and It had gotten blacker.  I’d felt that I had entered a residential area which might have concerned me anyplace else.  But I’d glanced at a satellite view of the area, and knew that it was surrounded by homes.  What was alarming, and what you REALLY don’t want to hear at a time like this, was,

“TURN LEFT – HERE and NAVIGATE OFF-ROAD!”

I said, out loud, “No!” did a U-turn and found my way to the hotel with my iPhone, my face lit up from the glow of that 3.5 inch display.

My point in telling this story here, and to the 800 Maine educators gathered in Augusta yesterday, is to say that this northern state did not say, “No!”  They’ve been courageously and inventively navigating off-road for ten years, and in no small way paving new avenues to learning –– and too few of us are following.

The last time I keynoted the ACTEM conference, I composed a list of conditions that indicate that you’re in Maine. I don’t think I can improve on that list, which I’ve included below. But I would add one item.

You know you’re in Maine, when you believe that you have a firm and compelling vision of where education needs to be going, only to find yourself struggling to re-frame that vision, simply to catch up with the conversations around you.  A Wordle of the Twitter backchannel feed illustrates this beautifully, where students and learning stand out, and you have to struggle to find mention of technology.

Here’s my list from 2006, most of which is still true.

You know you’re in Maine when…

  1. The first thing attendees to your workshop ask is, “Do we have WiFi?”
  2. Teachers are checking their students work, during the workshop, on their comput’a.
  3. When you insist on tech support for your hands-on workshop and none was needed.
  4. When, in a workshop, everytime you ask, “How many of you have done this before…?” and nearly every hand goes up.
  5. When two members of your workshop organize their own workshops in the back of the room.
  6. They don’t give out a conference bag at conference registration, because everyone’s going to be carrying a computer bag anyway.
  7. The former governor of the state is attending an education conference.
  8. Nearly everything that people say, in an easy-going, slow, mumbly sort of way, carries wisdom!
  9. When you had to fly in a little soapbox derby sort of plane to step into the future.
  10. When you start to feel optimistic, and think, “You know, we may just be able to turn this thing around.” 

..then you know your in Maine!

I’d add that if you fly into Portland’s magnificent new airport, you can avoid the soapbox derby plane.

World Earthquakes 2011 Visualization

This infographic is fairly intense. It is a time lapse map of all the earthquakes that occurred in 2011. It was created by someone in Asia, and has I think Japanese writing on it, so much of it can’t be read, but it still is very interesting. It is a great way to show this […]

This infographic is fairly intense. It is a time lapse map of all the earthquakes that occurred in 2011. It was created by someone in Asia, and has I think Japanese writing on it, so much of it can’t be read, but it still is very interesting. It is a great way to show this kind of information.

When studying plate tectonics, show a portion of this to your students. Have you students do research on parts of this video, each group of students taking a month, or a couple of months, and do research on the earthquakes that occurred during that time period. See if there is any correlation between them, what kind of damage was done, if anything was learned from that particular earthquake. See if your students can find some type of pattern, or lack there of.

Show your students earthquakes that happened in new areas. For instance, in the summer of 2011, there was an earthquake in Virginia that was felt all the way down in Raleigh, NC. What caused an earthquake here? What movement of the plates caused earthquakes that happened elsewhere? Have your students create infographics sharing this information.

Blog: http://visual.ly/world-earthquakes-2011-visualization-map

Where Do We Go to Measure Success?


We hear it just about everywhere and every time we turn around –– STEM. The country (USA) desperately needs more scientists, Technologists, Engineers and Mathematicians. It’s our way of securing our superiority and prosperity and ramping up S, T, E & M instruction in our schools is the way to succeed.

In preparing for a talk to parents in suburban Edmonton, Alberta this week, I searched for data on Canadian college graduates and the degrees conferred to them. In the process, I ran across a report from the U.S. Institute of Education Sciences.* I copied a data table called Bachelor’s degrees conferred by degree-granting institutions, by field of study, and converted it to an Open Office Spreadsheet (ODS) file to see what I might learn from the data.

The table offered the number of graduates receiving degrees from 32 fields of study, from selected years between 1970 and 2010. I devised and ran formulas that calculated the percent of change in the number of degrees by decade. I also created an additional set of rows that calculated the percent of each years total graduates receiving specific degrees to factor out the effects of changes in the total number of graduates. When sorting the degrees by the percent of increase from 2000 to 2010, the rank was somewhat surprising.

At the bottom of the list, the fields showing the least growth, was Computer and Information Sciences. Though the 1970s saw an impressive increase in computer science degrees (469%), the increase dropped to 42% during the 80s, 33% in the 90s, and then a decline (-32%) during the first decade of the 21st century.

Other fields suffering declines were education, and english and literature/letters, both bested slightly by Engineering technologies, which fell only 17% (-17% change). Falling less than that were agriculture, architecture, liberal arts, sciences, general studies and humanities, topped by engineering, with a 6% (-6% change) decline. Just better than engineering was theology and religious vocations (-5% change).

Enjoying substantial increases in degree from 2000-2010, from high to low, were communication technologies; military technologies; legal professions; parks, recreation, leisure and fitness; homeland security, law enforcement and firefighting; library sciences; and visual and performing arts. (see graph)

Click Graph for Larger Version

This was a fairly startling discovery to me, considering the funding, resources, and time invested in STEM education and its cost to other subject areas, not to mention the political capital gained from reciting the mantra to constituents and voters.

It the results were such a surprise that and I’ve questioned my math several times, checking and rechecking the formulas.  I invite you to double check my spreadsheet [here].

If this is, indeed, an indication of our students’ interests in science, technology, engineering and mathematics during the early 21st century, then is STEM education doing what its suppose to do –– even if test scores are rising?

Please double and triple check my spreadsheet. and if you find problems with my formulas, please post them in my comments.


* United States. Institute of Education Sciences. Bachelor’s degrees conferred by degree-granting institutions, by field of study. Washington, 2011. Web. <http://nces.ed.gov/programs/digest/d11/tables/dt11_286.asp>.