
 |
We hear it just about everywhere and every time we turn around –– STEM. The country (USA) desperately needs more scientists, Technologists, Engineers and Mathematicians. It’s our way of securing our superiority and prosperity and ramping up S, T, E & M instruction in our schools is the way to succeed.
In preparing for a talk to parents in suburban Edmonton, Alberta this week, I searched for data on Canadian college graduates and the degrees conferred to them. In the process, I ran across a report from the U.S. Institute of Education Sciences.* I copied a data table called Bachelor’s degrees conferred by degree-granting institutions, by field of study, and converted it to an Open Office Spreadsheet (ODS) file to see what I might learn from the data.
The table offered the number of graduates receiving degrees from 32 fields of study, from selected years between 1970 and 2010. I devised and ran formulas that calculated the percent of change in the number of degrees by decade. I also created an additional set of rows that calculated the percent of each years total graduates receiving specific degrees to factor out the effects of changes in the total number of graduates. When sorting the degrees by the percent of increase from 2000 to 2010, the rank was somewhat surprising.
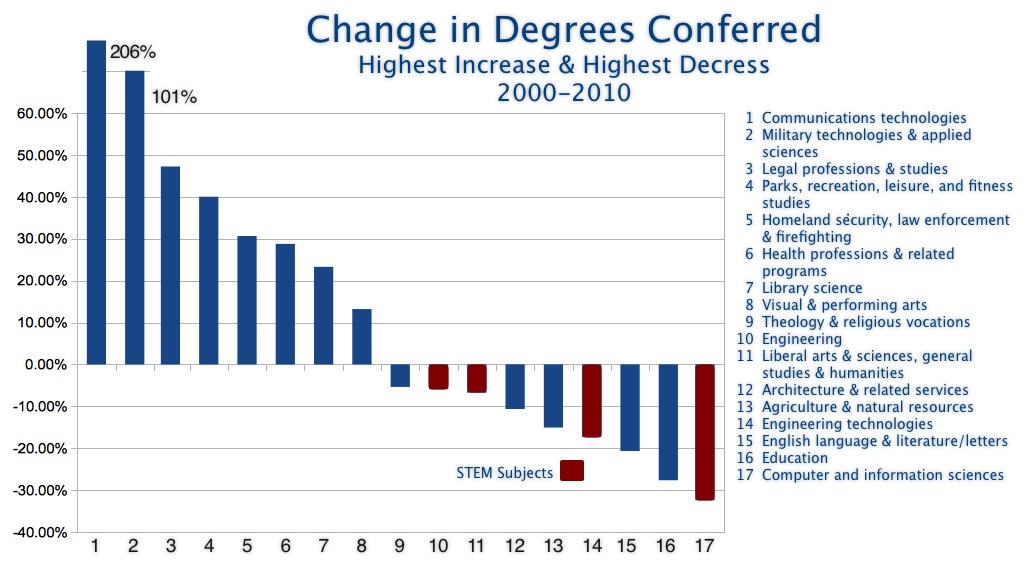
At the bottom of the list, the fields showing the least growth, was Computer and Information Sciences. Though the 1970s saw an impressive increase in computer science degrees (469%), the increase dropped to 42% during the 80s, 33% in the 90s, and then a decline (-32%) during the first decade of the 21st century.
Other fields suffering declines were education, and english and literature/letters, both bested slightly by Engineering technologies, which fell only 17% (-17% change). Falling less than that were agriculture, architecture, liberal arts, sciences, general studies and humanities, topped by engineering, with a 6% (-6% change) decline. Just better than engineering was theology and religious vocations (-5% change).
Enjoying substantial increases in degree from 2000-2010, from high to low, were communication technologies; military technologies; legal professions; parks, recreation, leisure and fitness; homeland security, law enforcement and firefighting; library sciences; and visual and performing arts. (see graph)
 |
| Click Graph for Larger Version |
This was a fairly startling discovery to me, considering the funding, resources, and time invested in STEM education and its cost to other subject areas, not to mention the political capital gained from reciting the mantra to constituents and voters.
It the results were such a surprise that and I’ve questioned my math several times, checking and rechecking the formulas. I invite you to double check my spreadsheet [here].
If this is, indeed, an indication of our students’ interests in science, technology, engineering and mathematics during the early 21st century, then is STEM education doing what its suppose to do –– even if test scores are rising?
Please double and triple check my spreadsheet. and if you find problems with my formulas, please post them in my comments.
* United States. Institute of Education Sciences. Bachelor’s degrees conferred by degree-granting institutions, by field of study. Washington, 2011. Web. <http://nces.ed.gov/programs/digest/d11/tables/dt11_286.asp>.
I’ve seen those numbers for computer science over and over. Much of the drop is attributed to two things. The dot-com bust, and the drop in the number of women going into the field. I think there’s more going on than a drop in interest. I think that many students start out in stem fields but don’t finish. The question is why. Is it teaching methods? Is it lack of support? Is it that, as I’ve heard some people say, that students are lazy? I don’t know. I would love to see that research.
Over here in the UK we have the odd scenario of Physics graduates being targeted by Corporate Banks. If you are a bright graduate with a silly amount of student debt (thanks to Mr Clegg and friends), would you choose a lower paid job in a laboratory or a higher paid job (with bonuses?) in an office. The fact that scientific research is woefully underfunded is more of a factor than governments care to admit. People need to see the career path in order to embark on it.
I wonder if it might be interesting to look at degrees conferred as a proportion of the (college-age) population in each of the years? (as opposed to the raw numbers and proportion of degrees?)
I’m not sure that one can interpret these results fully without considering things like changes in availability of jobs in certain fields, or the way in which certain university degrees train for specific jobs more directly.
Also, how are fields like “Communications technology” and “Military technologies and applied sciences” not considered STEM? Seems odd to me. (This may be my ignorance of the definition of STEM).
Interesting (yet not surprising) to see Education dropping. As I’m sure those in Edmonton filled you in, the job market for teachers is crowded and seems only to be getting worse as the Baby Boomers more slowly retire than originally anticipated. Nice article and thanks for sharing!