I recently ran across a Gallup/Knight Foundation survey entitled American Views: Trust, Media and Democracy. The poll of more than 19,000 U.S. adults aged 18 and older attempts to measure how our changing information landscape has affected media trust in the U.S. and made it harder for the news media to fulfill their democratic responsibilities. It is important to note that Trust, Media and Democracy was a nationally representative mail survey. So a back-of-your-mind question should be, “Who took the trouble to share their views by mail?”
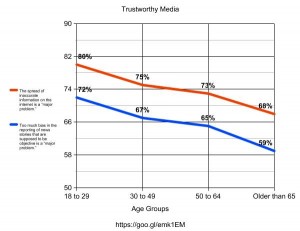
That said, a couple of things especially caught my attention. First, it seems that younger respondents were more likely to consider the intentional spread of inaccurate information over the Internet and bias in the media to be a “Major Problem.” See graph 1.
It leads me to wonder if we (educators) did a better job than we thought, over the past 10 to 15 years, of teaching our students to be critical media consumers. Or perhaps it’s a result of a generation who is, unquestionably, more net-savvy than their elder. Regardless, we have more work to do.
 What disturbs me is how many people do not really know what “Fake News” is. Wikipedia defines it as
..a type of yellow journalism or propaganda that consists of deliberate misinformation or hoaxes spread via traditional print and broadcast news media or online social media. Fake news is written and published with the intent to mislead in order to damage an agency, entity, or person, and/or gain financially or politically, often using sensationalist, dishonest, or outright fabricated headlines.. (Wikipedia)
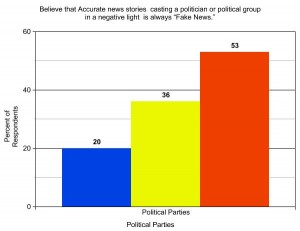
That pretty much aligns with my own understanding of “Fake News.” Yet 20% of Democrats believe that an accurate news story that casts a politician or political group in a negative light is “Fake News.” The percent is higher for Independents and Republicans. See graph 2
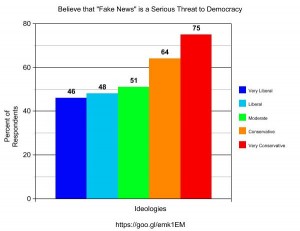
This one surprised me, that the more conservative a person is, the more likely they are to consider “Fake News” to be a serious threat to democracy. See graph 3 and please explain this to me.
There is much more available through the PDF report, which you can download at: https://goo.gl/emk1EM
I created the graphs from the survey data using Create a Graph from the Department of Education web site.

