One of my most anticipated activities, during extended times at home, is going to the movies. Alas, I am always surprised with how busy I become, and so, I haven’t been able to see as many as I’d hoped — which means that I have more to look forward to.
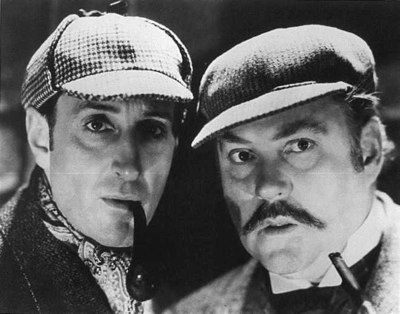
Brenda and I drove up to the Regal last night to see Sherlock Holmes with Robert Downey Junior. The movie was all that I’d hoped it would be. It was visually rich, the characters were real, the script was fine, the action was almost overwhelming, the audio was loud (even for me) but effective, and the special effects were as transparent as I’ve seen. Yet, it was missing something. The movie wasn’t very interesting. Walking away from the theater, Brenda and I both agreed that we were bored — a mystery to me, because I couldn’t think of why.
Getting back home a little too early for bed, I posted comments about my disappointment on Twitter and Facebook, and just now (6:50 AM) scanned through a surprisingly large number of responses. Many people agreed, but just about as many people seemed to love the movie, mentioning the attributes I have already listed, especially the FX.
We found it to be boring… I think part of the problem was they forgot to include the audience in the mystery and in solving the mystery. There was no way you could watch the movie and say “why didn’t I see that clue?!”
For an icon of “mystery,” there was no mystery. You knew the villain the first time you saw him, and regardless of his court-ordered demise, you knew — well enough spoiler. I agree with Gail’s observation. I was not a part of the show. I was not invested. I was merely a spectator, and for that, I felt short-changed and wondering why.
It reminds me a bit about some research I explored a while back (can’t find the blog post) showing that we learn well, what surprises us. It’s the unexpected discovery that impacts our memory.
No impact in this movie. Though Robert Downey Junior, Jude Law, and Rachel McAdams are all three memorable visions — no surprises will, no doubt, leave no lasting impressions.
Four Crystal Balls, by Valdemar Horwat ((Horwat, Waldemar. “Four Crystal Balls.” Flickr. 28 Mar 2009. Web. 27 Dec 2009. <http://www.flickr.com/photos/naturalturn/3393185440/>.))
Obviously, this started out being a list of predictions about 2010 and beyond. But, after working on it for about a week, I concluded that the questions we are asking, as we move toward the future are much more interesting. ..and, of course, the biggest and most interesting question for 2010 is, “What are we going to call it, two-thousand and ten or twenty-ten?” Anybody? Anybody?
Let’s get down to brass tacks, and getting down to brass tacks is actually a great way to begin. It’s not a very old expression, as expressions go — first used in an 1863 issue of The Tri-Weekly Telegraph, a Texas newspaper. The line said,
When you come down to ‘brass tacks’ – if we may be allowed the expression – everybody is governed by selfishness. ((Martin, Gary. “Get Down to Brass Tacks.” The Phrase Finder. Web. 23 Dec 2009. <http://www.phrases.org.uk/meanings/get-down-to-brass-tacks.html>.))
..and this, more than anything else, is what drives the future. What we are able to imagine and invent is easy. It’s limitless. We can go in any direction we want. The “want” is the question. What will help us answer our questions, solve our problems, or accomplish our goals — as we perceive them or as we are persuaded to perceive them. Will this new 3Gs iPhone help me do my job? Will increasing my taxes bring down greenhouse gases, feed and house the poor, and provide a more relevant education for our children?
So, perhaps the best way to predict the future is to explore our questions/problems.
This first one really isn’t want-based. But it’s one that nagging at us all. What is Apple going to unveil at the Yerba Buena Center for the Arts, on anuary 26? ((Gelles, David. “Exclusive: Apple to host event in January.” Financial Times 23 Dec 2009: n. pag. Web. 28 Dec 2009. <http://blogs.ft.com/techblog/2009/12/exclusive-apple-to-host-event-in-january/>.)) My prevailing question is, “Will the built-in features of Apple’s alleged Tablet make it a (the) ideal learning technology? ..or will Apple have to contrive instructional applications as they (and others) have done in the past for their new ‘game changers’?”
This is a big one for me. Does learning performance, as measured by annual test scores, accurately and appropriately predict success in a future that is characterized by change? I’m looking for research to be done that correlates the level of life success in adults to their success as students.
Even if we conclude that high stakes testing is harmful to our children, no tipping point in the greater education conversation is going to kill it. An alternative is necessary, and I wonder what kind of killer app might emerge that makes electronic portfolio assessment (or other procedure) simply look too perfect to resist. Is there some new digital tool on the horizon or, might there be something that’s already out there, but has not yet reached a critical mass, that is going to change the game? What’s the next big thing? What will be the buzz at ISTE 2010? (see this conversation David Jakes started on Posterous)
Are we (teachers) going to become digital users or subscribers? For decades we have been comfortable using packaged instructional content (textbooks, etc.) to help students learn, and this was probably necessary in closed learning environments. But with astoundingly abundant information, might we become our own packers. I’m curious about the emergence of video search. Hulu, the web-based TV service, now allows viewers to search the closed caption text of qualifying movies and TV shows. ((Wei, Eugene. “Search Captions on Hulu.” Hulu Blog. Hulu, Hulu LLC.. Web. 28 Dec 2009. <http://blog.hulu.com/2009/12/21/search-captions-on-hulu/>.)) It’s a bit quirky, but another step toward making a universe of digital content more accessible and workable by teachers and learners. Will we take advantage of all this abundance of content, or continue to limit ourselves to the comfort of subscribing and prescribing?
What’s to come of social networking? Will we, as a larger defining education community, come to accept social learning techniques and integrate them, or will we continue to fear and block these opportunities?
Will the current economic bottom-drop curtail the proliferation of 1:1 learner to computer environments, or might it cause an acceleration? There are two other prevailing questions that nag at me,
What technologies constitutes a true ubiquitous personal digital learning tool?
How will ubiquitous personal digital learning tools affect the learning cultures of schools, classrooms, and our larger learning environments?
A huge question-mark resides over the future of textbooks. I continue to wonder if we might discover that going digital could be a cheaper way to help students learn than continuing down the road of pulp-wood based learning resources? ..and “Will somebody (textbook industry or open source community) create a new “textbook” platform that truly harnesses the qualities of digital networked learning? Kindle is not the answer!
Where does my job as a teacher stop? I think that much of the network conversation, that will continue to take place out there, will be about this question.
Just how much influence might I have, as a teacher, on the learning that my students are engaged in outside of my classroom and outside of the school’s bell schedule?
How might emerging ICTs enable more interesting and potent learning experiences beyond the confines of traditional schooling?
How responsible am I to pursue these opportunities or do I continue to follow the traditional role of teacher and leave tech and the networks to the “natives?”
OK, so I do have some predictions after all for 2010
Personal Learning Networks (PLN) will not get easier to explain.
We will see some form of augmented reality in the exhibit hall at ISTE 2010, so watch where you point your 3G iPhone.
Increased acceptance of social networking applications will continue, as security concerns are addressed and as we come to realize the benefits for conversational learning and learning management.
High stakes testing will die, and it will die quickly and embarrassingly. But this will happen only after there is a compelling alternative.
The next big “cool” thing will be augmented reality. But, although it will enable some interesting and useful instructional opportunities, like so many big “cool” things before it, AR will not live up to its hype.
Mobile and cloud computing will continue to rise in popularity and application, but not as fast as we wish. They are both limited by infrastructure and penetration.
That’s it for now. I may revisit this blog post in the next minutes or months.
I’ve seen things you people wouldn’t believe. Attack ships on fire off the shoulder of Orion. I watched C-beams glitter in the darkness at Tannhäuser Gate. All those moments will be lost in time like tears in rain. Time to die. ((Fancher, Hampton, and David Webb Peoples, Script. Blade Runner. Dir. Ridley Scott.” Perf. Hauer, Rutger. 1982, Film.))
Blade Runner, 1982
Some times I feel like Roy, the dying replicant (robot), lamenting the loss of one soul’s experiences — what sites he’s seen. We’ve been witness to some pretty amazing sites in just the last few years, and they have been both tumultuous and exhilarating.
We have been a part of a dizzying array of advances — and yet, change has been just slow enough that we do not see it nor do we think that much about it — amongst our every day endeavors. Of course, this paradox shouldn’t surprise us considering that as my country works hard to overhaul its healthcare system, and the world grapples in Copenhagen, to rein in global warming, what holds our attention is the infidelities of a professional golfer.
That said, I feel it is important that we, during this holiday season, be reminded that in the year 2000
You were probably still running Windows 98 on your PC, or OS 8 or 9 on your Mac — on which you were still using Hypercard.
If you used a laptop, you had to plug it into the Internet — and often through a telephone.
E-mail was still THE killer app because there was no MySpace.
To twitter was “to make high-pitched sounds, as of birds.”
There was no Firefox, no Flickr, and no Facebook.
The hottest thing going was Napster and the hottest MP3 player was the RIO, from Diamond Multimedia, with 32Mb of audio storage to brag about. (that’s 1/2000 that of today’s iPod Touch)
Some of what’s happened since 2000 has not been that noticeable, such as genetically engineered corn and applications of nanotechnology.
Some of it, we should have noticed more, such as our exploration of the Saturnian system, and skid marks left on the surface of Mars — and most of our textbooks still call Pluto a planet.
The software that you used came in a box with a paper manual — and you most likely paid for it.
PDAs had a stylus.
No one had a Blackberry or iPhone, and
If you owned a mobile phone — it was just a phone.
You weren’t blogging and if you maintained a web page, it was with Dreamweaver or Microsoft Frontpage.
ISTE was NECC and NECC was in Atlanta, and we don’t know what was hot, because we weren’t blogging it.
We were not worried about China and India, and we’d just gotten through Y2K with hardly a hitch — thanks to people from China and India.
..and Google pretty much looked the same that it does now.
Wireless Internet, iPhones, and traffic-displaying GPS would, to many, have seemed “indistinguishable from magic.”
What, that we would call astounding (magical) today, may we take for granted ten years from now — and how prepared will the students attending our classrooms today be for that future?
If you were teaching in 2000, then you remember a sense of professional pride, which has been stripped away for political gain.
In 2000, society’s most critical endeavor, education, had not yet been usurped by amateurs in Washington, and driven decades in the wrong direction by people who saw no further than the industry-modeled classrooms they’d attended decades ago.
What will 2010 bring? In the next few days, I’ll tell you…
I closed a recent blog entry (Two Days with Backchanneling) with some comments about the backchanneling activities for a workshop I did last week in Pittsburgh. In review, I switched from my own Knitter application (I was not able to repair it after my servers’ PHP upgrade a few weeks earlier) to TodaysMeet, which
…helps you embrace the backchannel and connect with your audience in realtime.
Encourage the room to use the live stream to make comments, ask questions, and use that feedback to tailor your presentation, sharpen your points, and address audience needs. ((Socol, James. “Create a Room.” TodaysMeet. Web. 20 Dec 2009. <http://todaysmeet.com/>.))
It worked much better than any of the other backchanneling tools I’ve used before — and with the help of a small app I wrote, it feeds pretty easily into my PMWikihandouts site.
So here are a few observations about the experience (as I see it) of opening up the conversation in a traditional presentation-style learning event.
Participants will get off track, especially in the beginning.
“Do you spell grits with one T?”
I suspect that youngsters, in particular, will get off topic and even abuse such a communication avenue — in the beginning. But like many new ICTs, it will settle as the tool becomes more of an established process of the learning environment.
The conversations can be quantified in two ways:
A word cloud can be generated from the conversation. (see the Wordle down & to the right)
Learners must type their names, so comments are autographed, making individual’s contributions measurable.
Learners gain understanding from the perspectives of other learners and gain traction for their own ideas. The channel is guided by the conversation. This can be a good thing, or it can mislead the conversation. Learners must be able and encouraged to interrupt the lecture or other learning experience to seek clarification.
Backchanneling provides an outlet and opportunity for deeper understand to participants who are already familiar with the topics being covered. I’ve seen this happen many times when I knew that there were people in the audience who were beyond the topics being presented, and I found, in reviewing the transcript, that they took the opportunity to learn more from each other.
Individual learners can be identified as knowledgeable in a specific topic or valuable because of their perspective — It’s identity-building.
Everyone learns: learners and teacher-learners. I never read the transcripts of my presentation backchannels that I do not learn something that I didn’t know before.
Backchanneling can be distracting (especially to folks older than 35). It can be difficult to both the learner and the presenter. It requires some experience and practice.
The transcript of the backchannel can be externalized, and this has many benefits:
Stakeholders outside of the class can visit the conversation, including: parents of students, other partner classes, the larger community, and education leadership.
Stakeholder participation assures an authentic form of accountability to the learner participants and the teacher learner.
The teachers can visit the conversation after the learning event as a form of self-evaluation, assessment of attainment, continued feedback on learning, and delivery of further relevant content.
When externalized on a Wiki or other collaborative publishing tool, the conversation can continue, with contributions from the teacher and from participating students.
When archived, backchannel transcripts provide content for learners who were not able to attend a particular lecture or conference presentation.
Although some say that backchanneling distracts them from the presentation, others say that it enhances their awareness of the topics being examined.
Like most things, there are advantages and disadvantages. I suspect that I will continue using it, especially after discovering TodaysMeet.
I’m sitting at Starbucks right now, working on “A Gardener’s Approach to Learning,” and I happened to glance at my Tweetdeck for inspiration — and boy! Illinois educator, Greg Noack says,
Why is it that, the more I learn and meditate on HOW kids learn, not what they learn. The less I have in common with other teachers. ((Noack, Greg. Twitter. 19 Dec 2009 08:11. Web. 19 Dec 2009.))
I immediately agreed and was inspired, as I usually am, when someone puts into words (140 characters) something that’s, until that point, been little more than fleeting thought.
But then, it occurred to me that an important and interesting question is, “Why?” Why is Greg and why are so many of us asking the question, “How do our students learn?” Certainly good teachers do that as an ongoing part of differentiating their classroom learning experiences. ..and it may simply be because we are talking a lot more and a lot more loudly about our professional reflections.
But if we are asking those questions more today, then why? Why today? ..when supposedly the purpose of my university experiences, my degrees, was to teach me how my students learn.
I’d like to suggest just a few possible reasons, and then let you have at it, while I continue my book writing.
We are recognizing that our students will be moving from their formal education into a world that we can hardly imagine. We are paying a lot more attention — and that’s us learning. How do I do it better? How might my students do it better, as a lifestyle rather than just something to do at school.
We are teaching within a rapidly changing information environment, and the technologies that facilitate the information’s flow are advancing — just about every day. We either learn it or ignore it — and many of us believe that ignoring it is professional malpractice.
And I have to wonder if working, playing, socializing, and dreaming within such a responsive environment literally turns us into a learning species — not that we weren’t before. But learning, in this kind of information environment, is just about as common as breathing.
Learning is at the core of teaching today — and just about everything else. So we’re thinking about it more.
Photo taken from the Battery in Charleston, South Carolina
First off, congratulations to all of the winners of this year’s EduBlog Awards. I continue to be overwhelmingly impressed with the ideas and the quality of writing that’s coming from young, fiercely dedicated, and creative educators. I also continue to be impressed with the continued contributions of us oldsters, with more experience and a more prolonged sense of history.
Raise your hand if you started teaching before personal computers.
Again, “Congratulations!”
I caught a couple of Twitter posts and Facebook updates just as we walking into the house last night after our short vacation in Charleston, connected to the Elluminate session and listened to the first several categories. But then it was time to rush out to the grocery store to stock up, with snow and other forms of treacherous precipitation on the way to Western and Piedmont North Carolina today.
We had a wonderful time in Charleston where the weather bent over backwards to accommodate (forecast of 80% chance of rain on the first day and we got sunshine the whole time). Lots of walks, lots of pictures, and some engaging and informative tours — including my first time out to Fort Sumter. I also spent some time at a wonderful independent coffee shop, City Lights, that remained busy, even with three Starbucks within the surrounding four square blocks.
Perhaps the best part of the travel was taking the train. It was a bit complicated by the fact that we had to change trains in Wilson, NC. But we enjoyed lunch at a dinner on the way out, and coffee and brownies at a coffee shop during an hour-long delay coming back home yesterday. But riding the train was an extremely relaxing way to travel, and I envy travelers in Europe and parts of the U.S. Northeast for their access to rail transportation.
It was also productive time for me, as I spent most of both directions, reading through and commenting on the backchannel transcripts from a day-long workshop last week near Pittsburgh. Usually when I process these things it is for one-hour presentations, and I’m usually rushing through them at the airport or wee hours of the morning. During this trip, I took my time, and enjoyed the richness of discourse that happens with smart people during a prolonged learning experience.
I’ve already written to much for this entry, and I need to get some work done on my new book before lunch time. I will share here, though, that I was forced to try a new backchanneling tool in Pittsburgh because of the very sad but unavoidable demise of Knitter. Alas, I was warned that upgrading my servers to PHP 5.0 in order to speed up Citation Machine, would possibly break some of my PHP applications. It did, and most of them I was able to repair fairly quickly. But, because Knitter was a hack of somebody else’s application, I was not able to track down the cause of its refusal to work — so I started searching.
What I found, was a delight — TodaysMeet. You name your room, indicate how long you want it to remain available, and even enter a hash tag that can be used by Twitter chatters, that forces their posts into the TodaysMeet stream. I even rigged a fairly simple way to move the transcript over to my wiki, so that the conversation can continue as part of the online handouts.
This is the power of backchanneling to me, that the conversation can continue, giving me a chance to visit my teaching from the perspective of the learners, and to visit topic aspects that I did not cover, and often didn’t even know. It multiplies the learning, in my opinion.
..the science of visual representation of “data”, defined as information which has been abstracted in some schematic form, including attributes or variables for the units of information.1
After that, the article starts to get a little thick. I would describe it as a variety of methods for expressing large amounts of data in ways that help that data to tell its story. Those of you who have seen my presentations about contemporary literacy, have probably watched me import into Excel™ earthquake data from the Advanced National Seismic Systems (ANSS), and then express that data by plotting each event’s longitude and latitude on a scatter plot. The result is a fairly recognizable map of the world through its numerous fault lines. It’s a dramatic demonstration of data visualization with just a handful of mouse clicks.
I have an ongoing Twitter search for posts that mention visualization, and — aside from the few new-age graphic psychedelics and wisp music, designed to cure me — I often end my work day by browsing the various announcements of data vis examples, new tools, and blog posts on the subject. It relaxes me.
Processing is an open source programming language and environment for people who want to program images, animation, and interactions. It is used by students, artists, designers, researchers, and hobbyists for learning, prototyping, and production. It is created to teach fundamentals of computer programming within a visual context and to serve as a software sketchbook and professional production tool.
The tutorials are decent and there are some fairly rich reference pages — which is where you do most of your learning when tackling a new programming language. What frustration I experienced came from wanting to do things I’m accustomed to doing with PHP, and finding that it is similar enough to PHP, yet different enough to have to resort to a lot of experimentation to make it work.
I finished the first project several days ago, starting in a realm of familiarity — earthquake data. I basically doctored the same dataset that I typically use from ANSS, using Excel to extract out the dates, magnitude, depth at the epicenter, and lon/lat coordinates — saving it all as a text file.
Using the graphing capabilities of Excel enables me to plot the locations of the quakes, or magnitude, or depth, or frequency. But not all at the same time. When I can literally talk to the computer, explaining in its language, what I want to happen with each data record, I can have it plot the locations and also size and color each dot according to the magnitude of the seismic event. I’ve also had it run the data chronologically, so that you see the month of December 2004 progress with each day displaying a bar graph with the number of quakes. The magnitude and depth of each quake is also illustrated. (see YouTube video above)
My second vis is based on data from Bowker, managers of the ISBN numbers associated with published books. The data includes the number of books published from 2002 to 2008, broken out by genre (agriculture, arts, biology, business, computers, etc.) My visualization (to the right) illustrates the percent of each genre among the total number of traditionally published books for each year. Of particular interest to me is the bottom part, where I show not only the increase of book publishing over the last few years, but the portion of published books that are on-demand printed and short runs — often self-published books. This indicates both an increased access to publishing by people like you and me and also the growth of self-publishing.
The point of this for education has four parts:
Literacy – It’s about communication, creating a lens through which the numbers that describe some object, action, or condition in the world can be readily seen and understood by an audience — in much the same way that sentences can serve as lenses to see what you see, hear, smell, and touch in your world.
Technology – It’s about learning to use the available and emerging technologies in order to work those numbers into a lens. The emphasis is on the Learning, not on the technology. What is new five years from now (one year from now or one month from now) will have to be learned. It will not be taught.
Mathematics – Building these visualizations was almost entirely about mathematics. It was not deep math, though I suspect that a better memory of Mr. Gilianti’s Trigonometry 104 class at Gaston College might have come in handy. It was not deep math, but it was a lot of thinking in the language of numbers. It was about working those numbers so that they would express themselves in ways that were visual and consistent to a visual theme.
Creativity – I mentioned that data visualization has become something of an art-form. It requires a certain amount of inventiveness to imagine the most effective expression of the numbers and to creatively evoke the unexpected. We learn well, what surprises us.
Friendly, Michael. “Milestones in the History of Thematic Cartography, Statistical Graphics, and Data Visualization.” York University. 24 Aug 2009. York University Mathematics Department, Web. 14 Dec 2009.?
I just got a table at Starbucks and sitting down to continue work on a new project — TBA. But during my walk up to the coffee shop, I was listening to some TEDTalks podcasts, and was struck dumb by something that Dan Gilbert said in his presentation, “How we are deceived by our own miscalculations of the future.” Quoting a Zen master, he said…
“If you want truth to stand clear before you, never be for or against. The struggle between ‘for’ and ‘against’ is the mind’s worst disease.” — Sent-ts’an
Rebecca Hatherley, photo taken by Kim Cofino during a similar meeting at a different time.
A few weeks ago, I was teaching a workshop to a large group of tech-savvy educators here in Wake County (Raleigh) North Carolina. During the workshop, I was surprised to learn that Skype was available to me, so I invited in a number of educators to speak with my audience about how they were using blogs and wikis professionally and with their students.
One of the more impressive entries into our workshop was Rebecca Hatherley, an educator in Doha, Qatar. I’d met her earlier this year during the 21st Century Learners meeting with Julie Lindsay at the Qatar Academy and knew that she was a tech enthusiast and practicing teacher. But she threw in a bit of a different angle on wikis, one that I really hadn’t considered before.
Hatherley is working on her masters degree via distance learning. She has set up a wiki that she uses across her courses to organize her learning into a grand central station point, bringing it all together. I’ve often suggested that as we move further into digital teaching and learning, and especially as we start to give our students more responsibility in selecting, compiling, and organizing their own learning resources, that one result might be a growing digital library that students graduate with — and continue to use and grow. Hatherley’s wiki was the first example of such a thing that I have seen — a learner grown and maintained library of content that will extend beyond her formal learning experiences. Rebecca mentioned that her wiki is being visited by other learners, world-wide, and that they are commenting on her contributions. Her library takes on some social aspects, which might play an even more prominent roll as her work continues.
Now this is not new. We are all building our personal learning libraries. They include our bookmarks (local and/or social), our blogs, our RSS feeds, the Twitter hash tags we follow, etc. But what Hatherley is accomplishing is something that hadn’t even reached my dreams yet — a central point of reference for all of it.
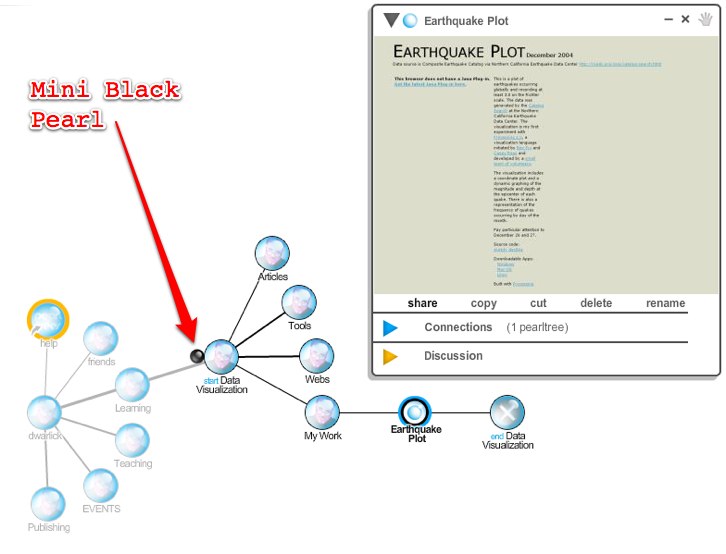
I was thinking about it this morning as I was weighing the benefits of getting up early against those of staying in bed and maybe getting another three hours of sleep. The digital library won. But just as I started sifting through stuff that had come in over night, I ran across a pearl — Peartrees to be more precise. According to the site:
Pearltrees is a collaborative network that let users create, enrich and share the world of their interests. We call it a human-powered interest network because its content is made and organized by its community.
What nagged at me about using a wiki as a central entry point to my library is that it would be predominantly text — relying on me to do a lot of scanning, reading, and rely on a bit more recall about where things are than I’m willing to commit to. Memory is a diminishing commodity for me.
Peartrees provides a rather slick intuitive graphical interface to web content of any type — as long as it has a URL. It’s basically folders, called Pearltrees, and they can be nested in a number of ways. In the image to the right, I’ve opened up my Learning Pearltree which houses another PT for Data Visualization. Within that Pearltree are others for articles about the subject, tools, web examples, and one for my own work, from which is revealed a pearl for the Earthquake plot I finished yesterday.
The site says that “..its content is made and organized by its community.” But in a way, the reverse is actually what is going on. If I click the little miniature black pearl that exudes from a select pearl or pearltree, then trees of other users related in some way, swosh in, becoming available for my exploration. So, in a way, the community forms around my content.
The jury’s still out on this most impressive tool. I can’t tell, at this point, whether it will become a daily and indespensable part of my work, or if it will become just another bookmark in my Delicious cloud tagged Web20Tool.
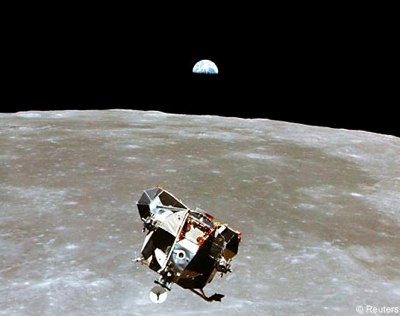
I had a short talk with my friend Paul Gilster last night while walking our dogs. As a reminder, Paul is the author of Centauri Dreams (book/blog). It’s a book, and subsequent blog, about visionary scientists who are plotting the method and means of achieving interstellar space travel within the next 50 years. I never walk away from Gilster without a renewed feeling of wonder (if my mind hasn’t been entirely blown apart by the possibilities), and I never leave these conversations without being reminded that my generation, in its youth, had a frounteer. It was set forth by John F. Kennedy on September 12, 1962, when he said,
We choose to go to the moon. We choose to go to the moon, In this decade and do the other things, Not because they are easy, But because they are hard. (( Kennedy, John F. “We Choose to Go to the Moon.” Rice University, Houston, TX. 12 Sep 1962. Address. ))
It’s the difference between the Sputnik challenge of the ’50s & ’60s and the educational challenge of this day. My teachers were challenged to educate a generation who would send people to the moon and beyond, to explore the frontiers of space. Today, we are challenged to “Race to the Top.” It sounds good, but what does the top look like? There’s no picture of it to inspire us. There is a vague sense that our children will graduate smarter than theirs — as measured by some Common Core of Education Standards.
There is another reason that these thoughts came to a head for me this morning. Next week, The House Committee on Education & Labor, chaired by 34-year Congressman Hon. George Miller, will hold a hearing to learn more about states’ efforts to help improve the nation’s competitiveness by adopting a common core of college and career readiness standards. Witnesses will be Hon. Bill Ritter, Jr, Governor of Colorado, Gene Wilhoit, Executive Director of the Council of Chief State School Officers, Doug Kubach, President and CEO of Pearson, and Cathy Allen, Vice Chair of the Board of Education at St. Mary’s County Public Schools.
I’m not going to criticize what the National Governors Association and the Council of Chief State School Officers are doing — have done, in developing these standards. It is good work. What I am critical of, is seemingly incredible lack of vision and imagination in setting a “Race to the Top” — a competition of test scores — as the frontier for this generation of youngsters. We must go much further than a mere listing of standards and measure of attainment. We must inspire students, teachers, and a society with a image of what that frontier looks like and what its reach will achieve — and it’s got to be a lot more than what’s inspired us over the past few decades — getting rich!
Assignment: So, here’s my topic assignment for youngster and teacher bloggers. What frontier might inspire us to race to a better, more exciting, and self-fulfilled future?


 After that, the article starts to get a little thick. I would describe it as a variety of methods for expressing large amounts of data in ways that help that data to tell its story. Those of you who have seen my presentations about contemporary literacy, have probably watched me import into Excel™ earthquake data from the


 The site says that “..its content is made and organized by its community.” But in a way, the reverse is actually what is going on. If I click the little miniature black pearl that exudes from a select pearl or pearltree, then trees of other users related in some way, swosh in, becoming available for my exploration. So, in a way, the community forms around my content.
 I had a short talk with my friend Paul Gilster last night while walking our dogs. As a reminder, Paul is the author of Centauri Dreams (