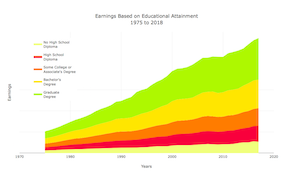
As engineers work to design better telescopes, both earth- and space-based, another kind of astronomy is taking place and teaching us astonishing things about our galaxy. Even though the Kepler space telescope ran out of fuel 8 months ago, the 1.38 terabytes of data (my calculation) that it generated is still being examined — by a new breed of astronomer who writes code at a computer, instead of watching the sky through lens.
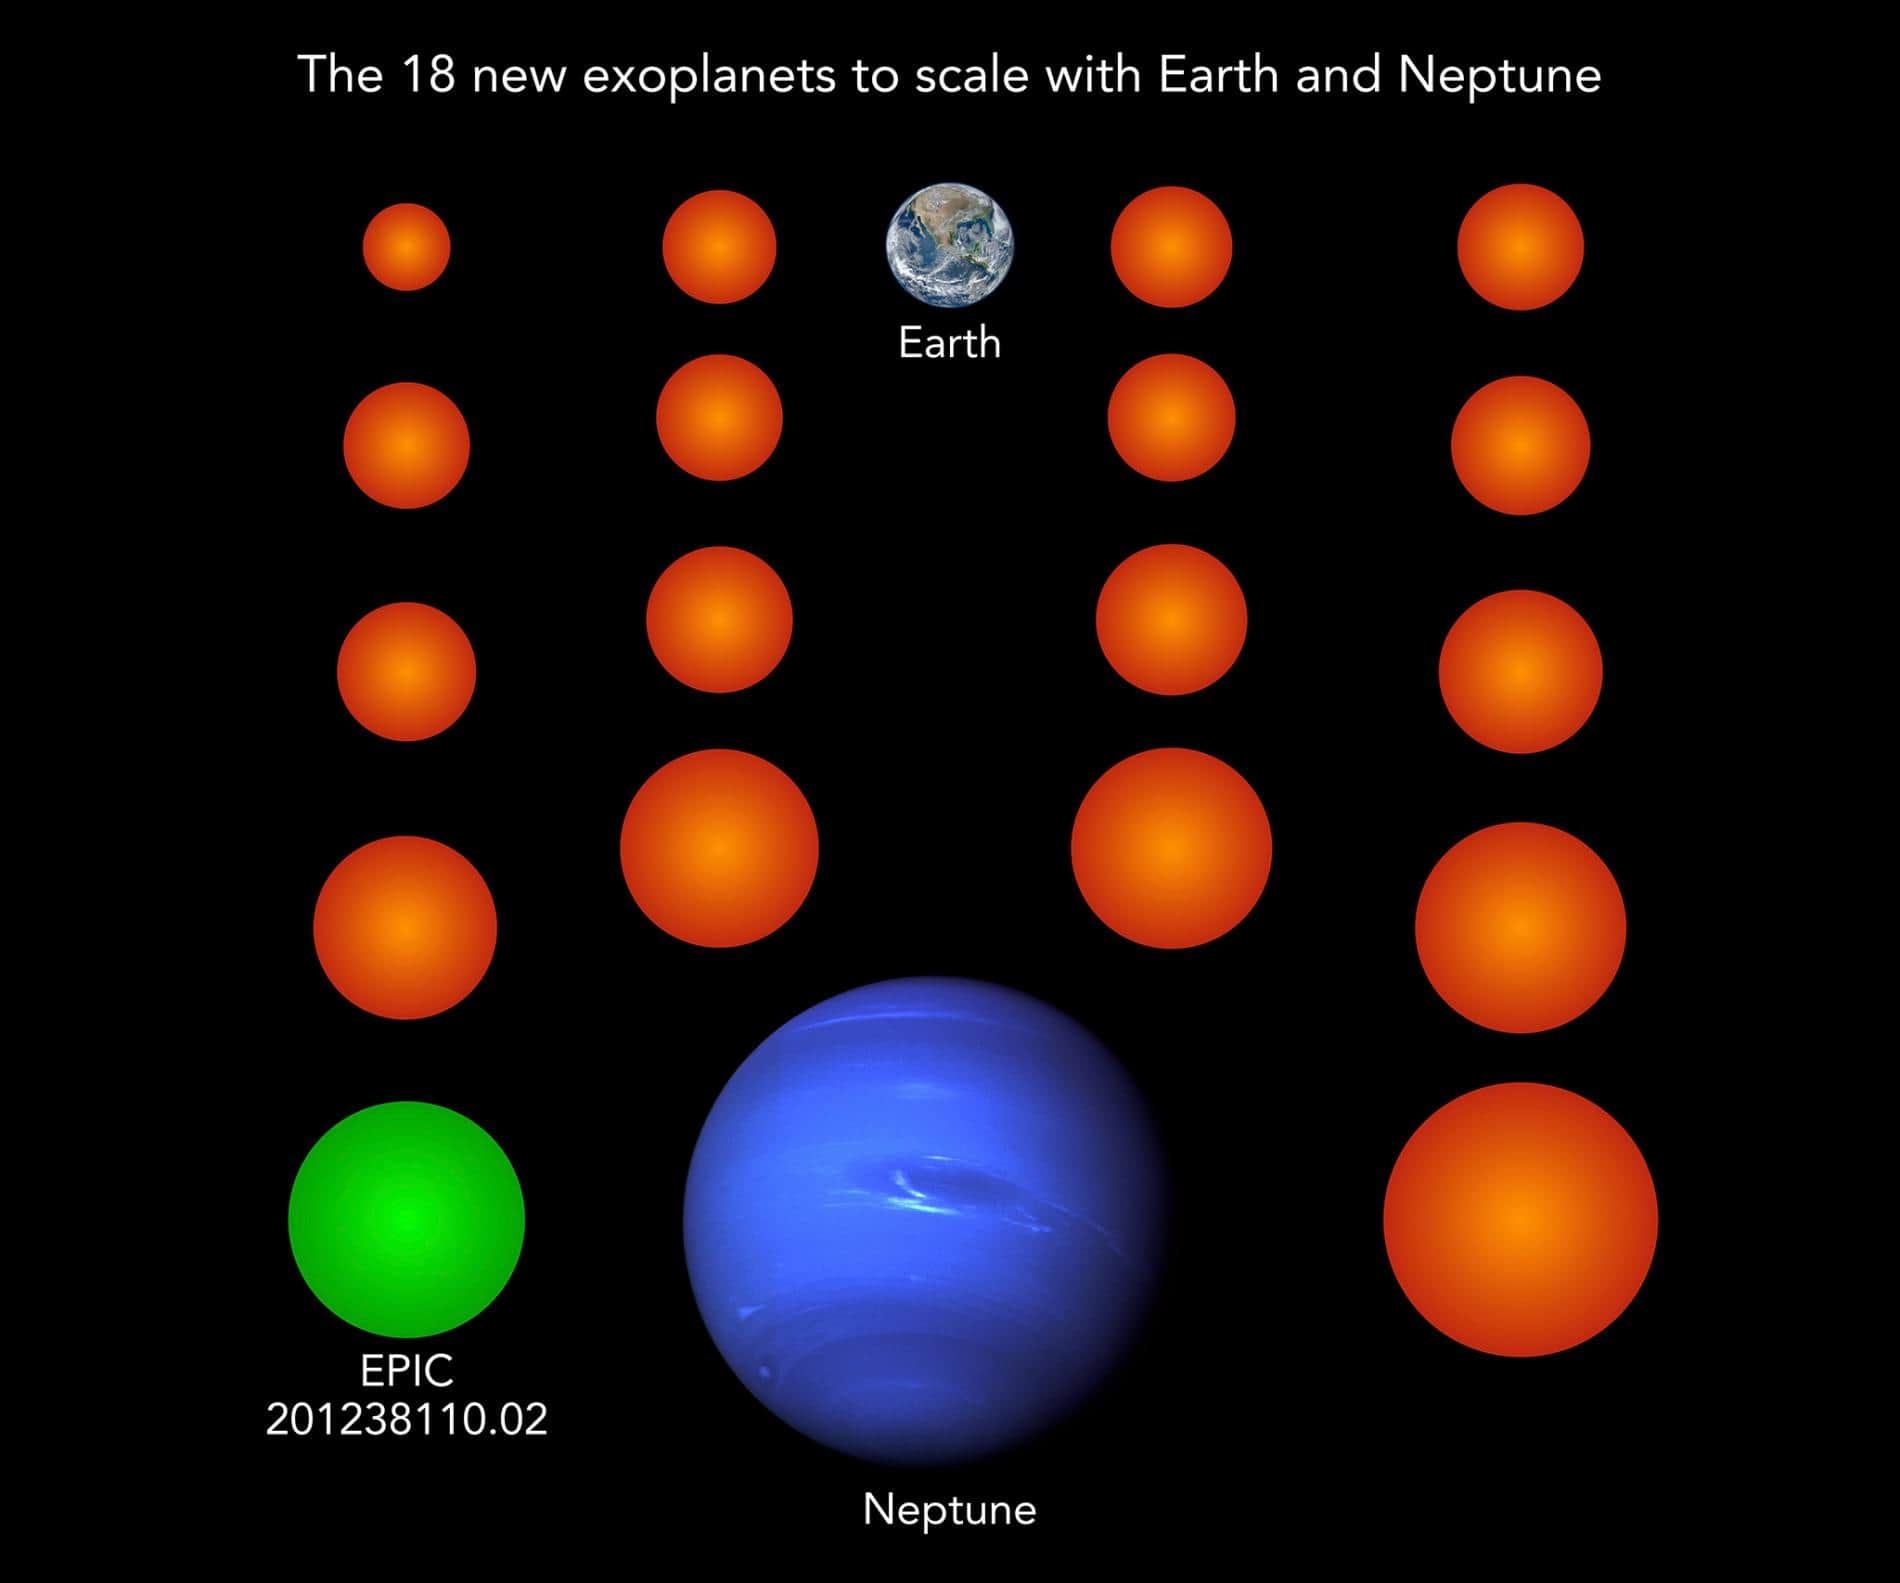
They are developing smarter algorithms to scan all that data to identify objects and phenomena that were previously hidden in the digital noise. René Heller, of Germany’s Max Planck Institute for Solar System Research, and his colleagues recently uncovered 18 new planets. All of them are small, with the largest being just a bit wider than two Earths. One of the worlds is among the tiniest Kepler has yet found; it’s just 70 percent of Earth’s width. Another orbits in the habitable zone of a red dwarf star, where the temperature might allow liquid water to remain on its surface.
Anna Alfonso has written a good description of data astronomy (The State of Data in Astronomy) in her blog, data iku.
There are now 3,972 confirmed exoplanets, worlds that are orbiting other stars, according to NASA’s Exoplanet Archive.
Initial Source: https://on.natgeo.com/2IlA7Xv