
I do not know how many times I’ve said to myself that, “I’ve learned my last programming language.” But it’s what got me hooked on computers, that in 1981 the only way to making them useful was to learn to program them.

During the last years of my advocacy work I became fascinated by infographics and data visualization. Data viz was more captivating because there was magic there, “..making numbers tell their story,” I use to say.
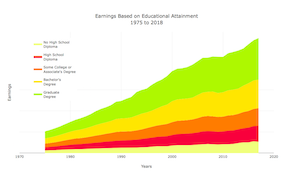
Anyway, reading about some of the visualizations being featured in the dataisbeautiful sub/reddit, I learned that a lot of people were using a language called R. Above are a couple that I’ve been working on for the past week or so. Click them to see the interactive versions.