A few days ago, I posted an article explaining “Why You Won’t See Me at ISTE ’14.” In it I wrote,
I blame and accept the fact that experience that spans from TRS-80 to IOS has become a little less important compared to the creative energy of much younger educators…
This sentiment prompted an email exchange with an old friend, an educator whose years of experience span pretty much the same range of technological advancement as mine, “TRS-80 to iOS.”
Our discussion, however, had almost nothing to do with technology, but concerned the era in which we began teaching.
For me, it was a full 25 years before No Child Left Behind standards-based teaching and punitive high-stakes tests stained the “art of teaching.” Things were quite different in terms of the autonomy that teachers exercised in determining what and how their children learned – and some mediocre teachers, admittedly, took advantage of the freedom. However, most, whom I came in contact with, used their academic freedom as a seedbed to create dynamic and effective learning experiences for their students.
For years I have felt that this-too-will-pass, that the arrogant belief that we can know and teach everything our children will need to know to be prepared for their future simply makes no sense, and that we would come to our senses.

But it occurred to me, during that email exchange, that more and more of the teachers in our classrooms today were trained to test-prep and have been indoctrinated to an education system based, more than ever before, on an industrial production model.
So I did some research and tinkering with a spreadsheet, and found that about half of the teachers in U.S. classrooms today have never worked in a school culture free from high-stakes testing.
To illustrate this, I made an infographic that shows the decline in teachers who have experienced academic freedom and the rise in teachers who have always worked under the constraints of government/corporate standards.
To be sure, this does not mean that there aren’t young educators, today, who are courageously and creatively going beyond the regimentation that is the character of test-prep classes, nor that there aren’t older teachers who are happy to model their classrooms on mass production.
But it does suggest a dramatic shift in the culture of our schools,
And perhaps,
An approaching point of no return.
About the Data:
I used a document from the National Center for Education Statistics a part of the U.S. Department of Education (see below). It featured demographic data about U.S. teachers, starting in 1987. The table included gender, ethnicity, age, education, years of experience, and teaching levels and subjects. I fairly easily imported the table into an OpenOffice spreadsheet and cropped it down to just the data on years of experience, starting with 1999.
To complicate things, the table included only data for every 4th year, 1999, 2003, 2007, and 2011, which was not enough to plot the level of accuracy that I wanted. In addition, the years experience were grouped, i.e. less than 3 years, 3 to 9 years, etc. I searched further, but could not find any more complete data at the national level. If you know of such a document, please comment below.
To fill in the blank years, I worked my OO spreadsheet so that it calculated trends from the 4 years and the experience ranges, and filled in the blanks, across and down, based on those trends. Not a perfect solution, but the point of my infographic was to illustrate a trend, not precisely measure a phenomena.
Having such a seemingly rich data set enticed me to plot for other trends and anomalies, such as specific rises or declines in teacher numbers, indicating times of sudden influx of new teachers, or increased retirements or, and I hate to suggest the possibility, mass resignations. Alas, it would take more completely accurate information to do such a thing, not just calculated trends.
Number and percentage distribution of teachers in public and private elementary and secondary schools, by selected teacher characteristics: Selected years, 1987-88 through 2011-12. (n.d.). Digest of Education Statistics. Retrieved April 19, 2014, from http://nces.ed.gov/programs/digest/d13/tables/dt13_209.10.asp

 There are a lot of developments here. Some of them we don’t appear to use anymore. However, without all of these developments, we would not be where we are today. Try to find scientists and poll them as to what are the most important developments, and then poll your students. After all the of the information is compiled, share with your students what the scientists said.
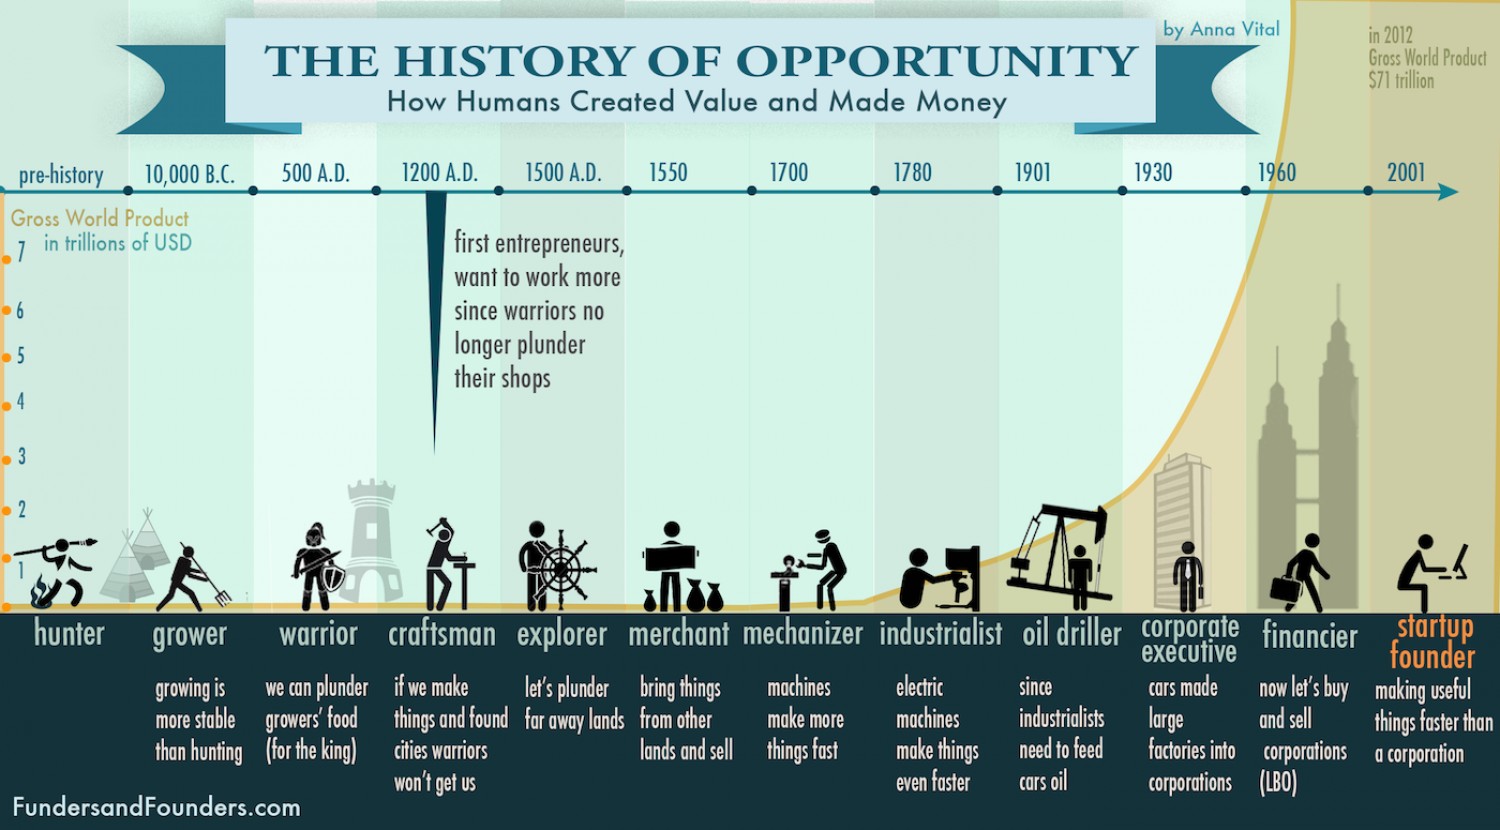

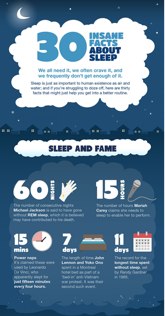 Begin this class on a survey of how your students sleep. What hours do your students sleep? How much sleep do your students get per night? How do your students personal habits affect sleep patterns?