Left, Right, Up & Down in U.S. Politics

I ran across an incredible web site today. As someone who is interested in politics, and especially its ongoing evolution, this really scratched an itch. It’s voteview.com and they record all rollcall votes cast by the U.S. Senate and House of Representatives, going back to the first congress of 1789-1791.

I was looking for data that I could visualize to indicate the degree to which Republicans and Democrats have crossed, implying times of compromise. But I found the following visualization on voteview.com that showed me exactly what I wanted to illustrate.

graphSm

I have marked the region between 1940, marking the beginning of the Roosevelt/Wallace administration and 1980, marking the beginning of the Reagan/Bush era. You notice a lot of crossover between Republicans and Democrats. The Liberal to Conservative scale was determined by the DW-NOMINATE or Dynamic Weighted NOMINAl Three-step Estimation.  I call that period “the good old days,” because it is the period of U.S. political history with which I identify and measure current conditions.

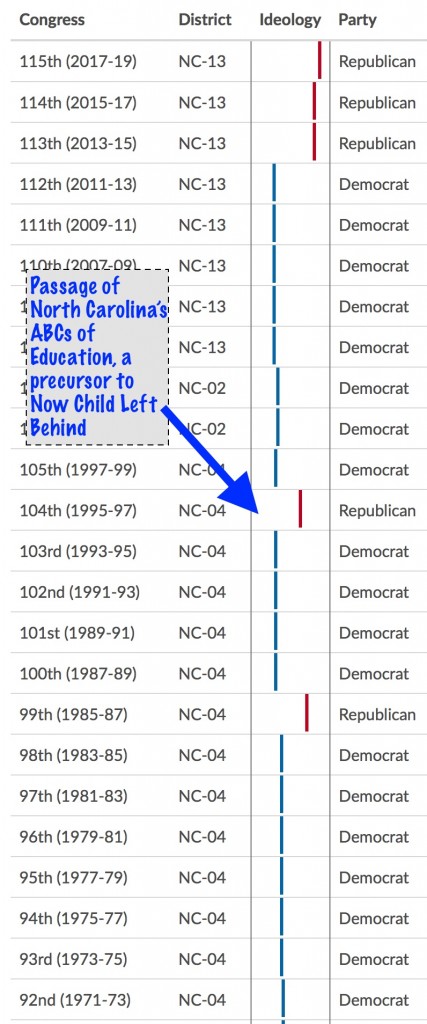
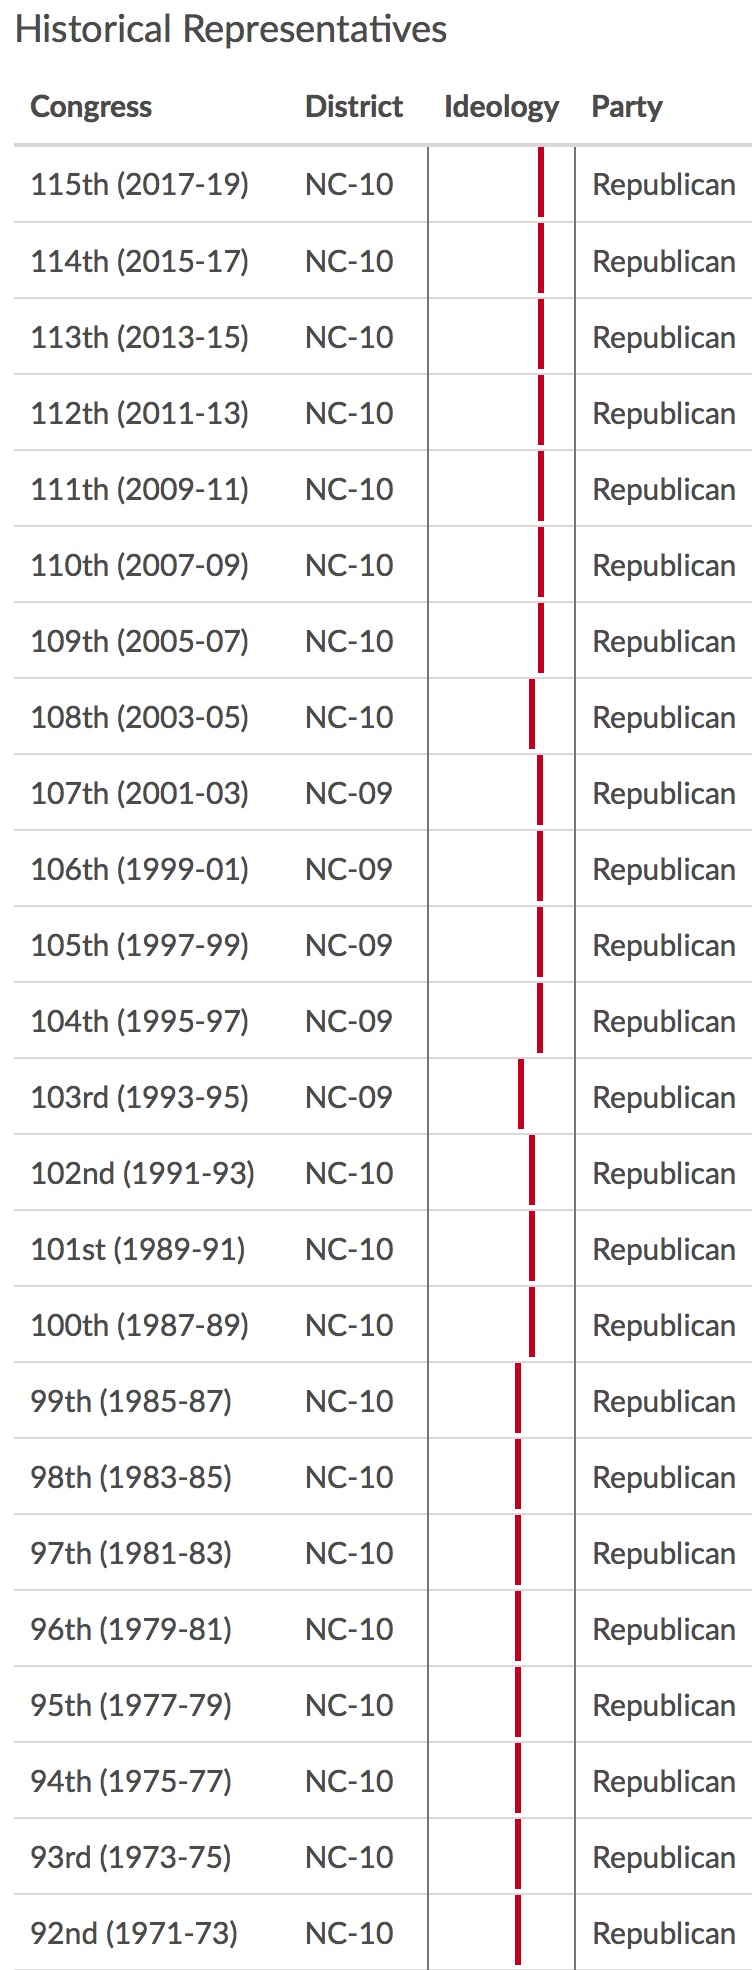
Another interesting application of DW-NOMINATE is the geography data.  You can enter your zip code and you see the ideology of your district’s representatives.  The positions of the red or blue bars are based on the NOMINATE index value of your representatives during that particular congress.  Below and left shows the ideologies of representatives from Raleigh, North Carolina going back to my graduation from high school.  The right shows the ideologies of representatives from Cherryville, my home town, going back to high school.  I just think this is cool!

GeoRaleigh GeoRaleigh

Lewis, Jeffrey B., Keith Poole, Howard Rosenthal, Adam Boche, Aaron Rudkin, and Luke Sonnet (2017). Voteview: Representing places through time. https://voteview.com/

Lewis, Jeffrey B., Keith Poole, Howard Rosenthal, Adam Boche, Aaron Rudkin, and Luke Sonnet (2017). Voteview: Parties Overview . https://voteview.com/

Paul Ryan is only Partly Right – a Small Part

Entitlements Tag Crowd

At the end of last year, our government gave away $2 trillion in federal revenue over the next 10 years, most of it going to the rich and corporations, especially the real estate industry thanks to last minute tweaking of the bill.

NOW congressional leadership is worried about debt and deficit. Paul Ryan said, “We’re going to have to get back next year at entitlement reform, which is how you tackle the debt and the deficit.”

He went on to say, “… it’s the health care entitlements that are the big drivers of our debt, … that’s really where the problem lies.”

Our Speaker of the House is talking about Medicare and Medicaid and I think he gets it partly right. I base that on a recent article (http://53eig.ht/2DkPugh) from my favorite data journalists at FiveThirtyEight, whose news comes from the numbers instead of manipulative rhetoric.

He’s partly right in that aging and income are only partly responsible for rising health care costs – and that’s a small part. According to a recent study from the Institute for Health Metrics and Evaluation, health care spending increased by $933.5 billion from 1996 to 2013. However only…

$133.3 billion came from increased population,
$269.5 billion from an aging population,

Disease prevalence and incidence resulted in a 2.4% reduction in spending while service utilization had no statistically significant effect at all.

The lion’s share came from price and intensity of service, accounting for $583.5 billion of health care spending. That’s pricing for prescription drugs and hospital mergers that reduce competition, among other factors.

The problem is not who’s getting the health care or who’s paying for it. The problem is a health care industry that seems free to bilk the American economy at a rate of 17.1% of our GDP. That’s a higher portion than any other country, except the Marshall Islands, who’s portion has shrunk from 30.8% (1995) to 17.1% (2014).

They need to address the health care industry, not who’s entitled to it.

Sources: https://goo.gl/QB1MYU, https://goo.gl/ZJpjQD, https://goo.gl/muTfJM,https://goo.gl/bsxp1Y, and https://goo.gl/yjrr4k

The Things that Catch my Eye

Google Street ViewNow this knocked me off my seat. Ever notice the automobiles people drive in your town or neighborhood? Using the same concepts that enable Siri, Alexa and Google Assistant to understand what they hear you say, scientists are designing computer systems that can understand what they see. It’s called “Deep Learning,” and it’s a form of machine learning, which falls under the broader umbrella of Artificial Intelligence.

Anyway, scientists from Stanford, Baylor and Rice Universities and the University of Michigan used images from Google Street View, 50 million of them, to infer the answers to questions about their communities and neighborhoods such as income, race, education and voting patterns. Specifically, they identified cars parked on the streets photographed by Google Street View cars and matched that with existing census and other survey data. The hard part, that required “Deep Learning,” was getting the technology to identify the make, model and year of all motor vehicles encountered.

One thing that they learned is that a neighborhood where pickup trucks outnumber sedans is 82% more likely to vote for a Republican in the next presidential election. Where sedans outnumber pickup trucks, 88% more likely to vote Democrat. So what do SUVs mean? ..and what about people with garages? ..and what television networks run the most pickup truck commercials?

I’ll be really interested when their computers can identify bicycles. 😉

Source: Proceedings from the National Academy of Sciences of the USA (https://goo.gl/is2nSX)

Change Your Mind

Fivethirtyeight, in their “New Year’s Resolutions” podcast asked other journalists to submit their new years resolutions. Kmele Foster, from The Fifth Column said that he wanted to make more “good use of the phrase, ‘I’m not sure.”

I like that!

My wife took me to see “Darkest Hour” a few nights ago, and Gary Oldman, as Winston Churchill, said something like, “If you’re not willing to change your mind, then you won’t be able to change anything.”

The heros of the next few years, will be those who are willing to change their minds.

Better Learning?

Two hands holding a video game controller
Playing a Video Game

I remember one particular week when my daughter was trying to learn the nine types of nouns for English class. She would be tested at the end of the week on her ability to label them in given sentences. Although she was a serious and conscientious student, my daughter struggled with some types of learning, especially memorization. She spent evenings that week, heroically and sometimes tearfully trying to distinguish common nouns from proper nouns, from collective nouns, from verbal, compound, abstract, concrete, countable and uncountable nouns.

Meanwhile, with our attention firmly directed to our her efforts, our son was left to his own devices. He was less academically challenged, but far less serious about school work and spent that week playing a newly-rented video game. Without the manual, he had to trial-and-error himself into the game’s dynamics. He failed and succeeded, made observations, formulated hypotheses, tested his hypotheses and constructed a mental toolbox of strategies so that he could play the game and save the damsel or slay the dragon – or whatever the goal was.

That week of watching my daughter struggling while my son played left me wondering, “Who was engaged in the learning that might be most appropriate for their future? Was it my daughter, who struggled to memorize the qualities of nine types of nouns, or my son, who was teaching himself how to play a complicated video game?”

Look to Struggling Students for Your Future Leaders and Game-Changers

Valedictorian Speech

Karen Arnold, a Boston University researcher has conducted a 14 year longitudinal study of high school valedictorians, finding that they rarely achieve fame and fortune. To be sure, they usually finish college, many earn graduate degrees and about half rise to top tier positions.

“But how many of these number-one high-school performers go on to change the world, run the world, or impress the world?” Eric Barker is asking this question in his new book, “Barking Up the Wrong Tree.” He cites another study of 700 American millionaires, finding that their average high school GPA was 2.9. Of course, not all millionaires are game-changers.

Barker seems to believe that there is a disconnect between the kinds of students we reward and the kinds of graduates that a rapidly changing world needs. He suggests two reasons for this incongruity, both of which I touch on in “The Quiet Revolution.”

  1. “Schools reward students who consistently do what they are told” – and life rewards people who shake things up. Arnold says that in high school, “we are rewarding conformity and the willingness to go along with the system.Speaking to a group at Business Insider’s New York office, Baker said, “In school, rules are very clear. In life, rules are not so clear. So a certain amount of not playing by the rules is advantageous once you get out of a closed system like education.”
  2. “Schools Reward being a generalist” If you are passionate about political history, you have to restrain that passion for time to spend on your Math, Science, Health, and English homework. The real world rewards passion and expertise.

Surprisingly, Arnold’s study found that students “who genuinely enjoy learning tend to struggle in high school. They find the education system ‘stifling’ because it doesn’t allow them to pursue their passions deeply.”

Lebowitz, S. (2017, May 29). Why valedictorians rarely become rich and famous — and the average millionaire’s college GPA was 2.9. Business Insider. Retrieved from http://www.businessinsider.com/why-high-school-valedictorians-dont-become-really-successful-2017-5

Are blue states financing red states?

I heard something on a podcast the other day that surprised me.  So I found the data and crunched the numbers myself, so that I would know (I love playing with spreadsheets).

It works like this.  Our southern neighbor, South Carolina, pays $24 billion in federal taxes.  However, the state receives in federal spending (benefits, grants, contracts, and salaries and wages) $48.8 billion.  That comes to $4,978.26 per South Carolinian that comes in from the federal government.  It becomes spending money.

In the other direction a northern neighbor, Delaware, payed about $22.6 billion in taxes but received only a little more than $9 billion in federal spending.  That comes to a deficit of $14,278.28, that’s not being spent in that state.

What’s interesting is that of the 30 states that benefit from federal spending, 21 voted to elect Trump as President, 14 of them by more than 10 percentage points.  Of the remaining states that are paying more in federal taxes than they are receiving, 9 voted to elect Hillary Clinton by more than 10 percentage points – that’s 9 of only 13.

When you put it all together, citizens of red states gain $915.70 from the federal government, and deep red states get $1,874.60 to spend.  Blue staters pay $176.84 and people living in deep blue states give up $2,101,84.

So where’s the logic in voting for a candidate who promises to reform federal taxes?

Sources:

The PEW Charitable Trusts: https://goo.gl/iFxBAp

The New York Times: https://goo.gl/6OkmXX


Is Print Really Better than Digital?

Business Insider reported on Sunday about a study that indicates that even though college students enjoy learning from digital texts more than print and believe that they learn better, the truth is that print is better.  The article, A new study shows that students learn way more effectively from print textbooks than screens, explores the work of Patricia Alexander and Lauren Singer, both from the University of Maryland. The two also reported their finding here at The Conversation.

The Business Insider article does a pretty good job of drilling down into the specifics of digital print’s failing – and I do not contest their findings. As a long time reflective user and producer of digital content, I recognize that you read differently and often for different reasons with a hand-held or larger screen. My concern is that certain conservative-leaning policy makers will see this as an opportunity to lash out at progressive educators with, “Your new way is not as effective as the old paper print.”

That conclusion reflects a gross and dangerous misunderstanding of technologies’ place in formal education, and a disgraceful lack of imagination. Sadly, the imagination required to understand what technology means to teaching and learning is lacking in  conspicuous sections of the professional education community.

I have long held that to understand how digital networked technology supports leaning we must reflect and come to understand how we are using tech to help us learn after school. We learn by researching and identifying the information that best helps us accomplish our goals, and achieving this by resourceful perseverance. We use the technology to find people and communities who are knowledgable and discussing the topics we need, and dynamically connecting with those communities. We learn in this digital, networked and information-abundant environment by being critical readers, always asking questions about the answers we find. To this end, textbooks are a detriment to effective learning, because they defy critical questions.

We need to understand how we (adults) learn through our screens after our schooling, because continued learning is the defining character of the future for which we are preparing our students.

The flaw in education is that we’re stuck in thinking about education and not thinking about learning – something we’re all intimately involved in.

Where Social Media Fails – It’s Us

No HateDemographics, or demography, is the statistical study of populations.  It encompasses the size, structure, and distribution of these populations. Demographics have long been used by decision makers in both government and commercial arenas.

Psychographics (a new word for me)  is the study and classification of people according to their cognitive attitudes, aspirations, interests, opinions, beliefs and other psychological criteria.

Cambridge Analytica is a company that uses big data mining to accomplish, among other things, “psychographic profiling.”  The company does this “..for political purposes, to identify “mean personality” and then segment personality types into yet more specific subgroups, using other variables, to create ever smaller groups susceptible to precisely targeted messages.”  THEY DID THIS FOR THE DONALD TRUMP PRESIDENTIAL CAMPAIGN.

Yesterday, ProPublica announced that they had successfully used Facebook, to direct mock articles directly to the newsfeeds of 2,300 people who’s psychographic profiles indicated interests in “Jew hater,” “How to burn jews,” or, “History of ‘why jews ruin the world’” – for $30.  The anti-semitic categories were immediately removed.  They had been created by computer algorithms, not by people. Facebook is exploring ways to fix the problem

For a long time I promoted and celebrated the people-power of social media, that it responds and behaves based on how we, people, use it. This characteristic is incredibly empowering and culture-enriching, and it can also be used to inflict great evil. For this reason, I also strongly urged educators and education leaders to refine their notions of what it is to be literate, that it is no long merely the ability to read and understand, but also the skills and habits of exposing what is true in the information that we encounter.

Sources:

Burleigh, N. (2017, June 8). How big data mines personal info to craft fake news and manipulate voters. Newsweek. Retrieved from http://www.newsweek.com/2017/06/16/big-data-mines-personal-info-manipulate-voters-623131.html

Angwin, J., Varner, M., & Tobin, A. (2017, September 14). Facebook enabled advertisers to reach ‘jew haters’ [Web log post]. Retrieved from https://www.propublica.org/article/facebook-enabled-advertisers-to-reach-jew-haters

Demography: https://goo.gl/AkfHdt
Psychographics: https://goo.gl/pjxPiM

Only Four Countries do not Provide for Paid Parental Leave.

While researching for this article, I ran across a 2013 NYT piece on Pew’s finding that in 40% of U.S. families the sole or primary earner is the Mom. In a quarter of married households, the woman is the sole or primary wage earner.

I was surprised recently when I learned that almost every country has federal laws that require paid parental leave.  Apparently, there are only four that do not.  They are Suriname, Lesotho, Papua New Guinea and The United States.  I’m including here the per capita Gross Domestic Product (GDP) of each country and their Gini coefficient, both of which seem relevant for considering the U.S. position on this issue.

Suriname

Per Capita GDP: $16,623

Gini: 52.9

Lesotho

Per Capita GDP: $1,091

Gini: 54.2

Papua New Guinea

Per Capita GDP: $2,517

Gini: 50.9

United States

Per capita GDP: $57,220

Gini: 40.8

The Gini coefficient is a mathematical measure of a nation’s wealth distribution. The lower the value, the more equitable their economy. Higher values indicate an economy that favors people who are already wealthy at the expense of the poor.  

Here is a list of the eleven top ten developed countries with their Gini indexes. Canada and the U.S. are tied for #10. The graph compares the wealth distribution of these eleven countries by their standard deviations from the mean.


    Gini Index
1. Norway 23.5
2. Australia 33.6
3. Switzerland 29.5
4. Germany 30.7
5. Denmark 27.5
6. Singapore 46.4
7. Netherlands 26.2
8. Ireland 30.0
9. Iceland 24.0
10. Canada 33.7
10. United States 40.8
Gini Coefficient for Top Developed Nations 
Sources:

https://statisticalfuture.org/?p=24
http://wikipedia.org/
http://pewrsr.ch/10ycfVX