It is with enormous pleasure that I will be part of the American School of Bombay’s 2014 Un-Plugged event in Mumbai, India. It is also an even bigger privilege to be working with International educators again. I’ve said many times that if I was in the beginning of my career, this is where I would be, expat’ing in some exotic land, making great friends, teaching great students and growing in educational institutions where innovation is part of the currency of success.
Even though my workshop, on Friday and Saturday, will be about visual literacy, and contemporary literacy will be part of the underlying theme of the day, this workshop will primarily and overwhelmingly be about something that I believe is the
Coolest thing on the Net,
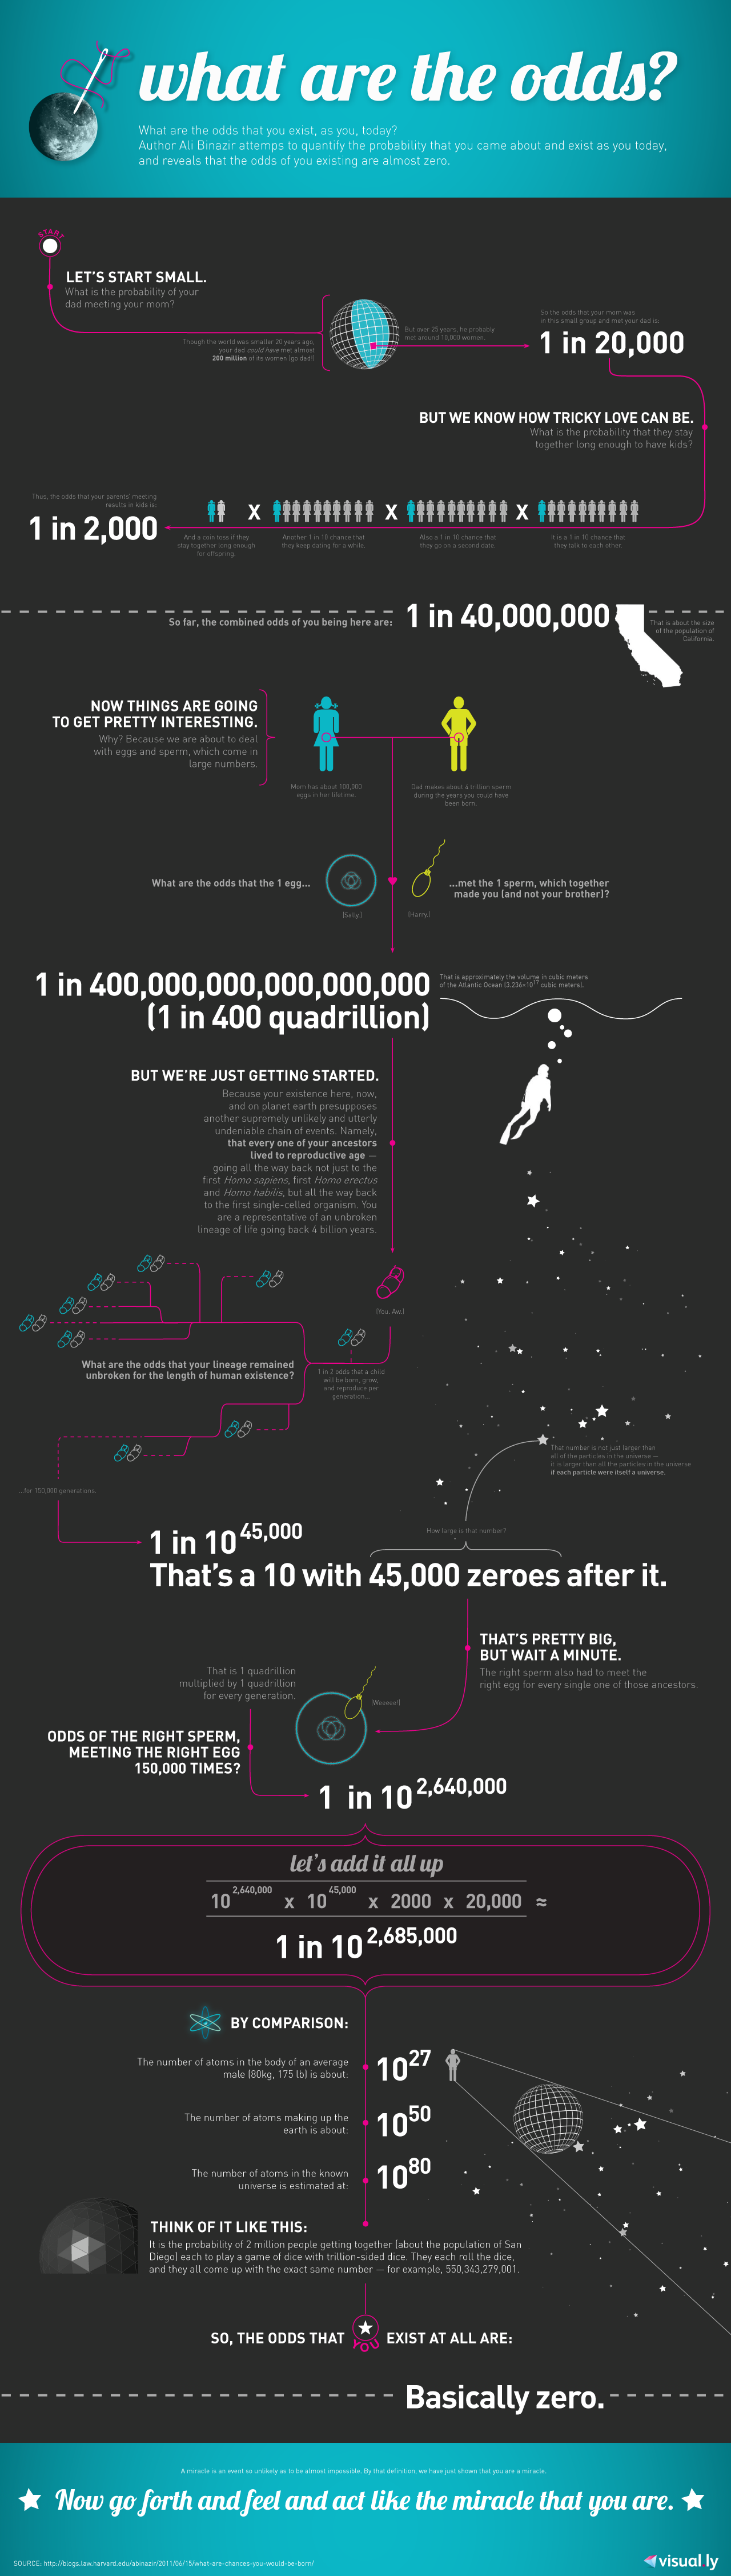
Infographics and Data Visualization
Of course this, and most all of what we do in our classrooms concerns basic literacy, “The skills involved in using one’s information environment to learn what you need to know to do what you need to do.” (my definition)
As a teaser, here are two word clouds. The first is taken from the descriptions of ASB Un-Plugged pre conference and hands-on workshops from 2012. The second comes from the same category of sessions to be held next week in Mumbai.
2012 Preconference & Hands-On Workshop
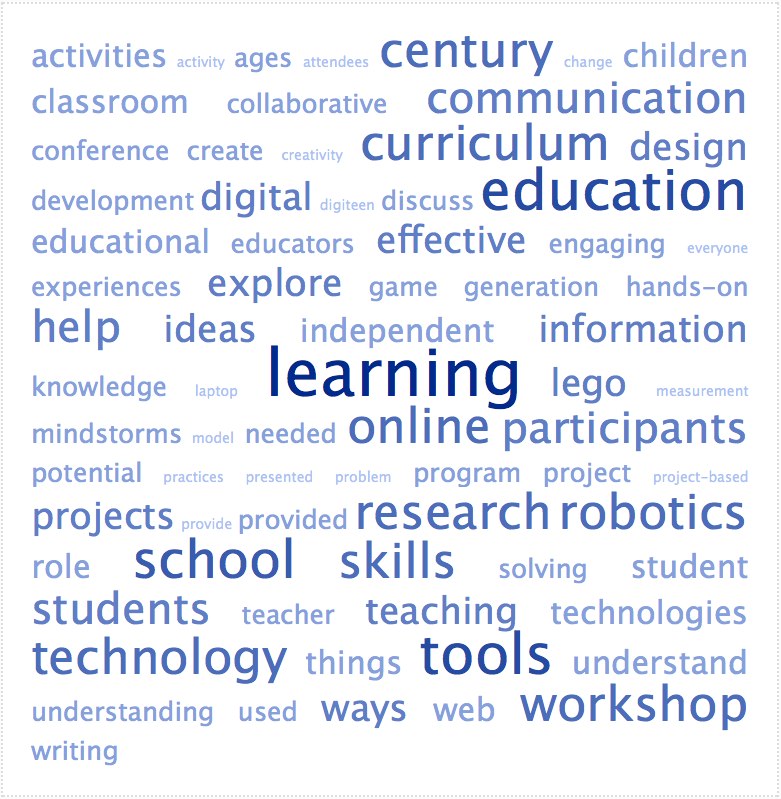
2014 Preconference & Hands-On Workshop

Of course, this is a small sampling of the themes that are part of the conversations hosted by the American School of Bombay. However I found a couple of things interesting. First of all, might it be that we are finally getting over this whole 21st Century craze. After all, we’re good and there. Also, design seems a little more prominent and create and maker/making have emerged.
I’m so looking forward to next week and counting on the journey being less challenging than last week.

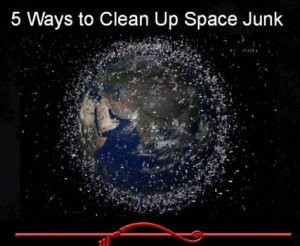
 In the 1960s, it was every child’s dream to be an astronaut. This was the age of the space race, or who would get into orbit and to the moon first. Of course, Russia beat America in getting into space, but we beat Russia in getting to the moon. With the International Space Station, it has become less of a competition against one another and more of a cooperation to gather knowledge.
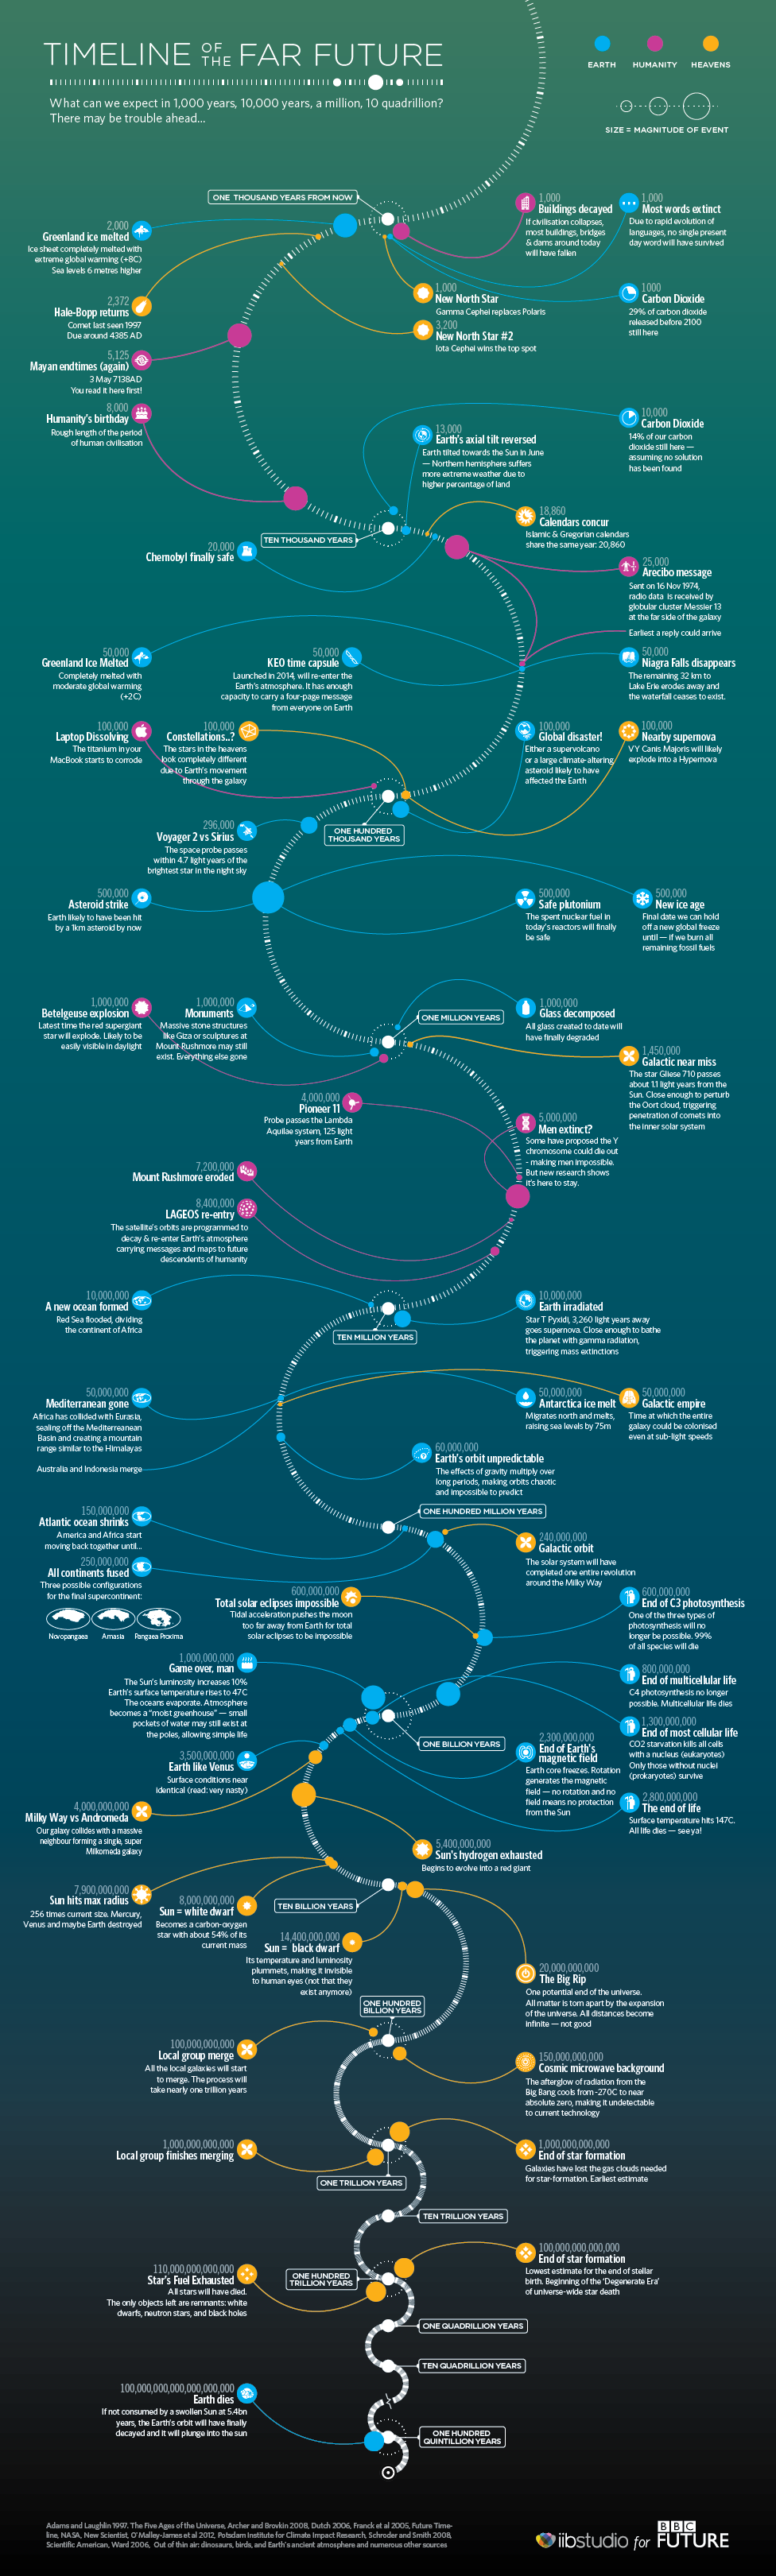 The good news shared by this infographic is that Earth should still be around for at least another one hundred quintillion years, at which point everything that is not biodegradable will be destroyed, although this infographic does mention even the decay of titanium in laptops. But this infographic goes into many more details that lead to the destruction of the Earth.