
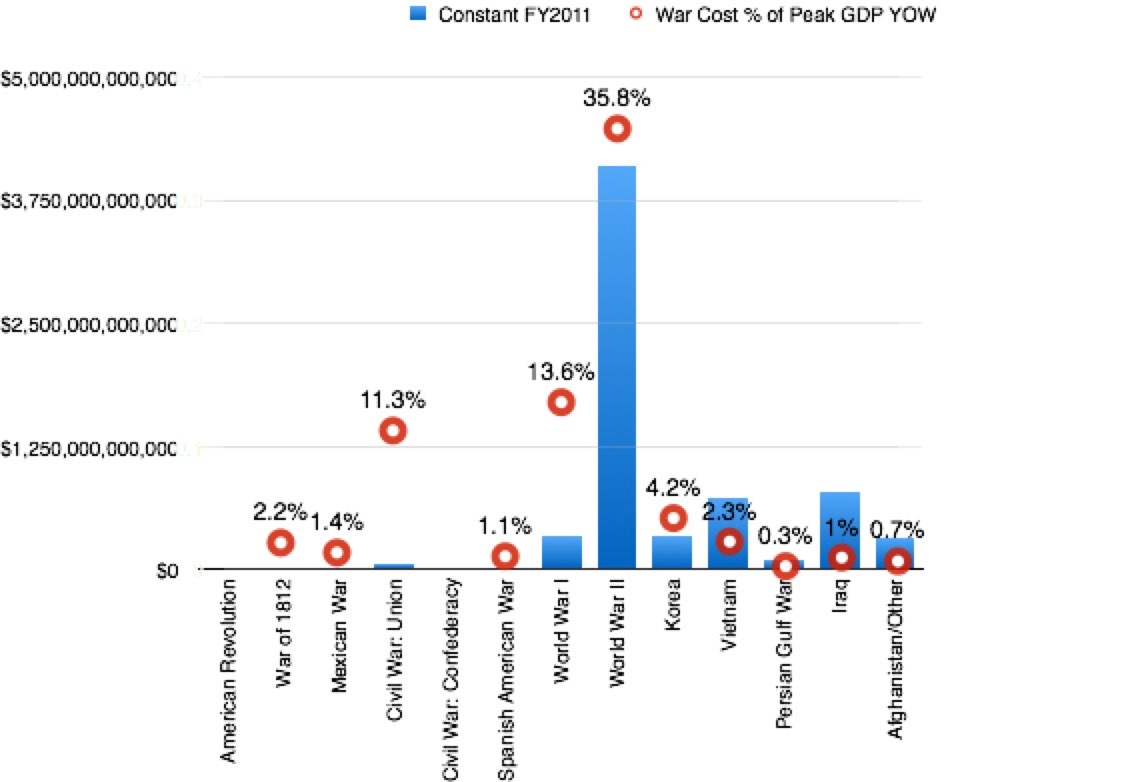
Woke up with an irritating insect buzzing in my head this morning. It was the cost of American wars. Weird! But, unable to sleep because of all the racket, I got up, climbed upstairs with my laptop and did some research, creating this graph based on data I gathered from a 2010 Congressional Research Services report.
The reason that mental insect was so darn irritating was the same reason that I was not surprised to learn that the post 9/11 invasion of Iraq was the second most expensive American war (WWII #1), toping the next, Vietnam, by 50 billion dollars. That’s in 2011 dollars.
What I can’t figure out is, “Why did Iraq’s cost ($784,000,000,000) represent only 1% of its peak year’s (2008) U.S. GDP, while Vietnam ($738,000,000,000) amounted to 2.3% of its peak year’s (1968) U.S. GDP?
If you have an answer, please comment here.
I hate to feed the troll, but it’s simply because the economy has grown. The US is making more products within its borders, and thus the GDP has gone up. what yo want to put on your graph is the REAL GDP. that is, the GDP with inflation taken into account.